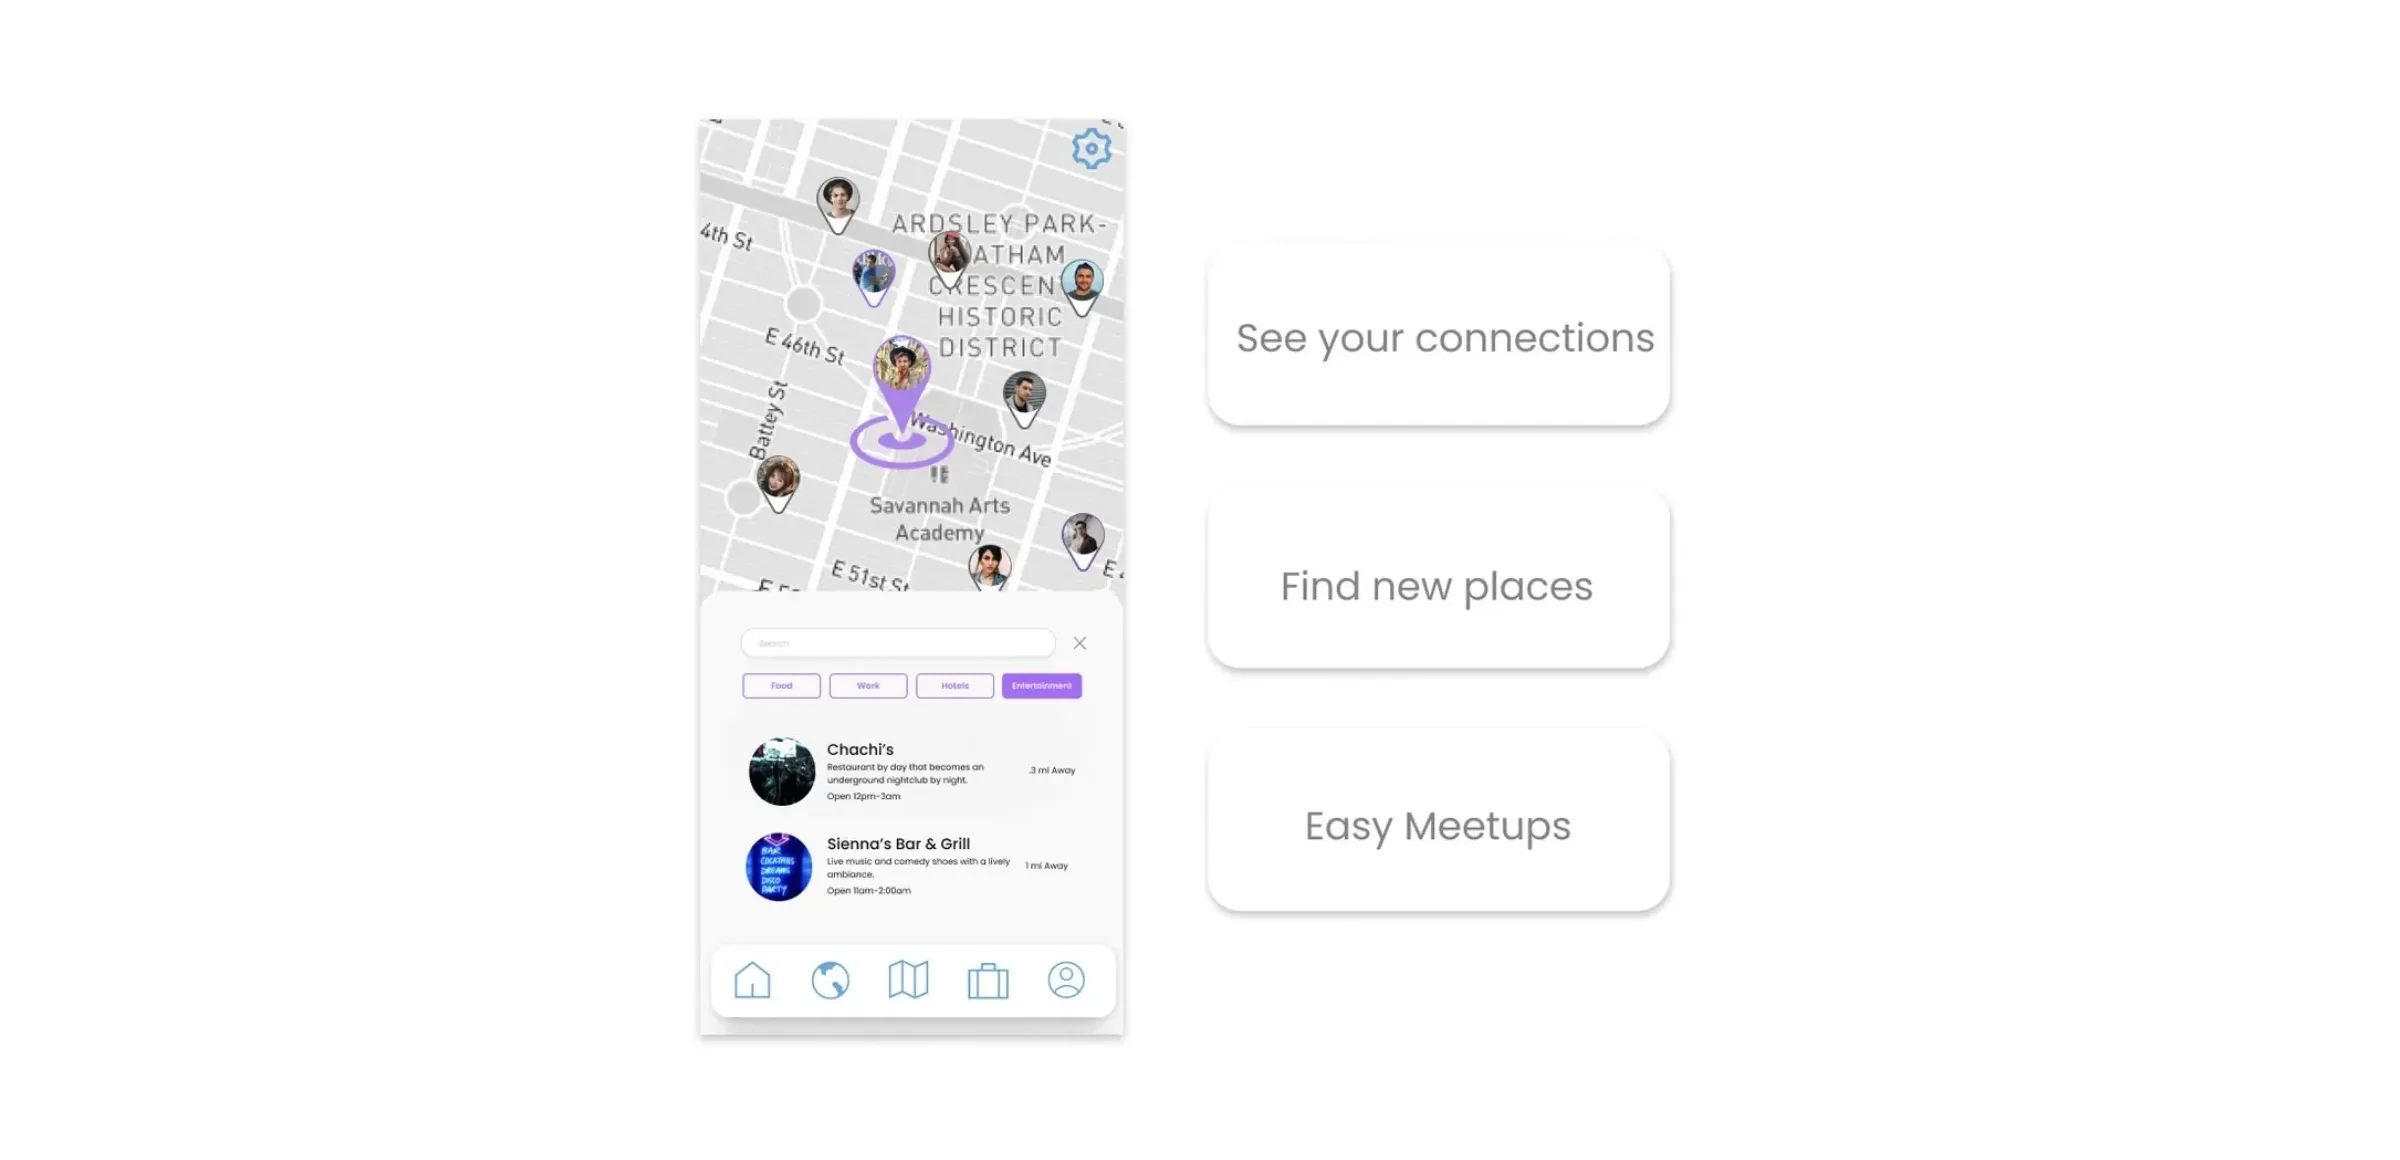
At a Glance
Role: Prototype Lead
Timeline: September 2021 to November 2022
Platform: Mobile application
Outcome: The dashboard redesign drew the strongest positive response of any change in testing
A platform built for a new way of working
Explorius is a mobile application for digital nomads that unifies trip planning, local discovery, and social connection in one place, addressing the isolation and planning overwhelm that hold people back from the nomadic lifestyle.
As digital nomadism surged during 2021, a clear gap in the market emerged. Existing apps handled either planning or connecting, but never both. Explorius bridges that gap, helping nomads find where to work, what to do, and who to do it with, all from their phones.
My Role
Prototype Lead · Created the mobile application platform based on secondary research and user feedback
Timeframe
September 2021 to November 2022
Planning a nomadic life is overwhelming by design
Digital nomads face a compound problem. Planning successful trips tailored to their lifestyle is overwhelming and stressful, and once they arrive, social isolation chips away at the freedom they came for.
A 49% increase in people identifying as digital nomads in 2020 meant a fast growing population with unmet needs. The existing toolkit, a patchwork of travel apps, Facebook groups, and coworking finder tools, left nomads scattered across a dozen platforms with no unified solution.
Help digital nomads be less overwhelmed and stressed when it comes to moving, working, and pre planning, while also helping them build real connections wherever they land?
Secondary research crystallized the core finding: digital nomads find it overwhelming and stressful to plan successful trips tailored to their lifestyles while preventing social isolation. These two problems, logistical and social, are deeply linked and need to be solved together.
Listening to nomads and those who want to be
Two surveys, 15 interviews, 4 sensory cue sessions, and 10 articles built a layered picture of what nomads feel, fear, and need. The research spoke to both active nomads and people who wanted the lifestyle but had not yet taken the leap.
Research Goals
Four goals framed the fieldwork: how nomads plan trips, how they work, what stops people from becoming nomads, and what wears them down once they are.
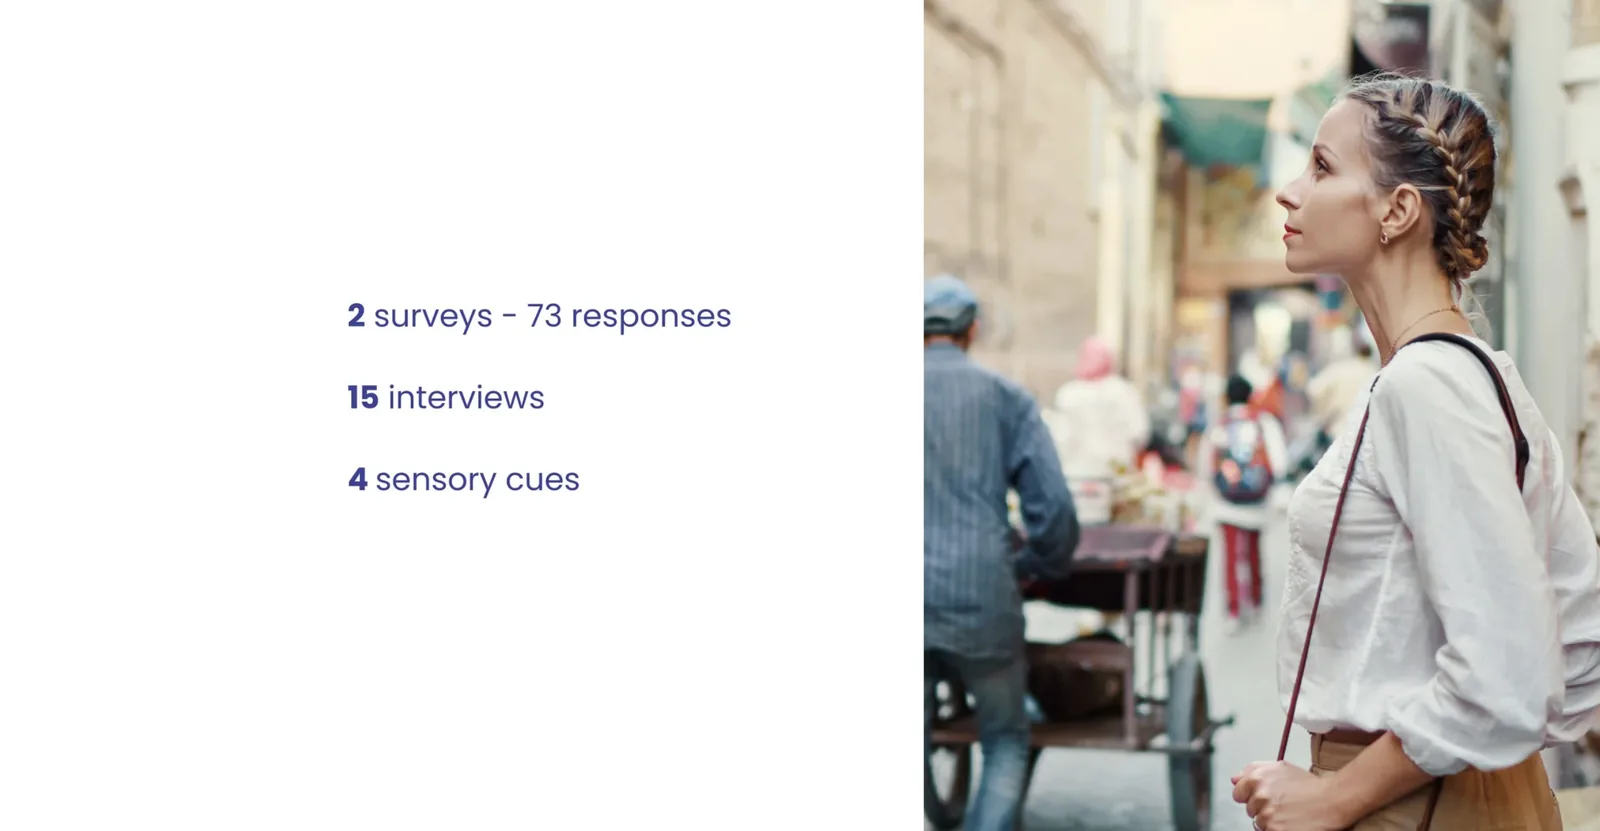
2 surveys with 73 responses, 15 interviews, and 4 sensory cues
Survey Data
Across 73 responses, 30% of nomads reported feeling socially isolated and only 20% felt socially adequate. The most actionable number came from people not yet traveling: 88% of non nomads like to travel, and what holds them back is company.
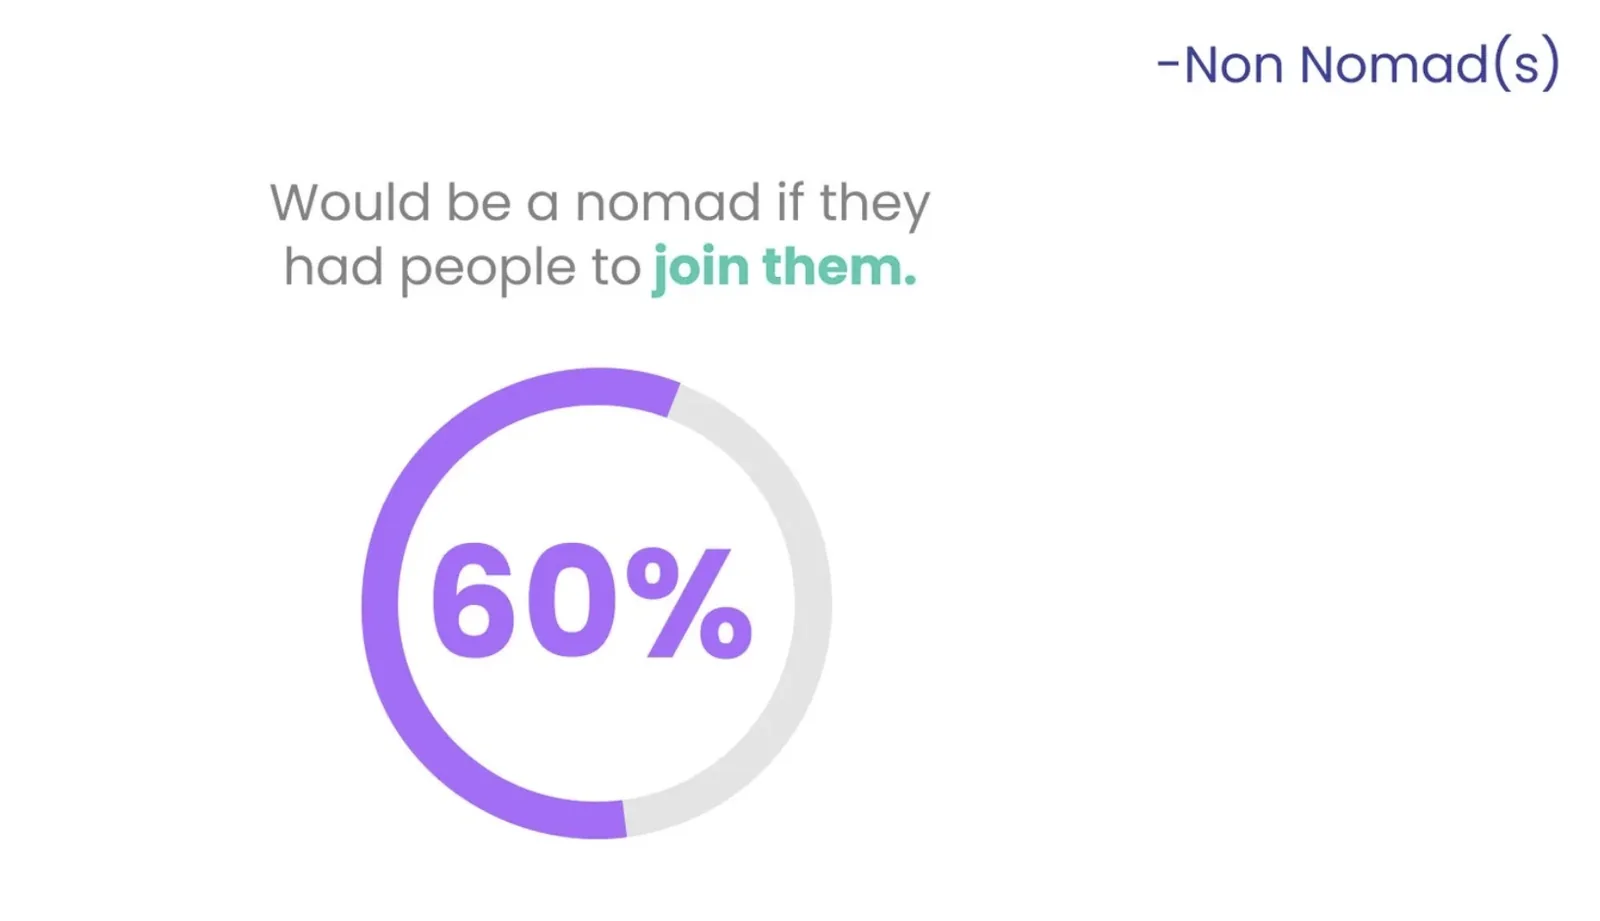
60% of non nomads would go nomadic if they had people to join them. This number is the product thesis
Interview Data
Fifteen interviews put language to the survey numbers. Nomads described disconnection and overcompensating at work; non nomads wanted a personal assistant for booking and feared that planning a whole trip would make the lifestyle feel like work.
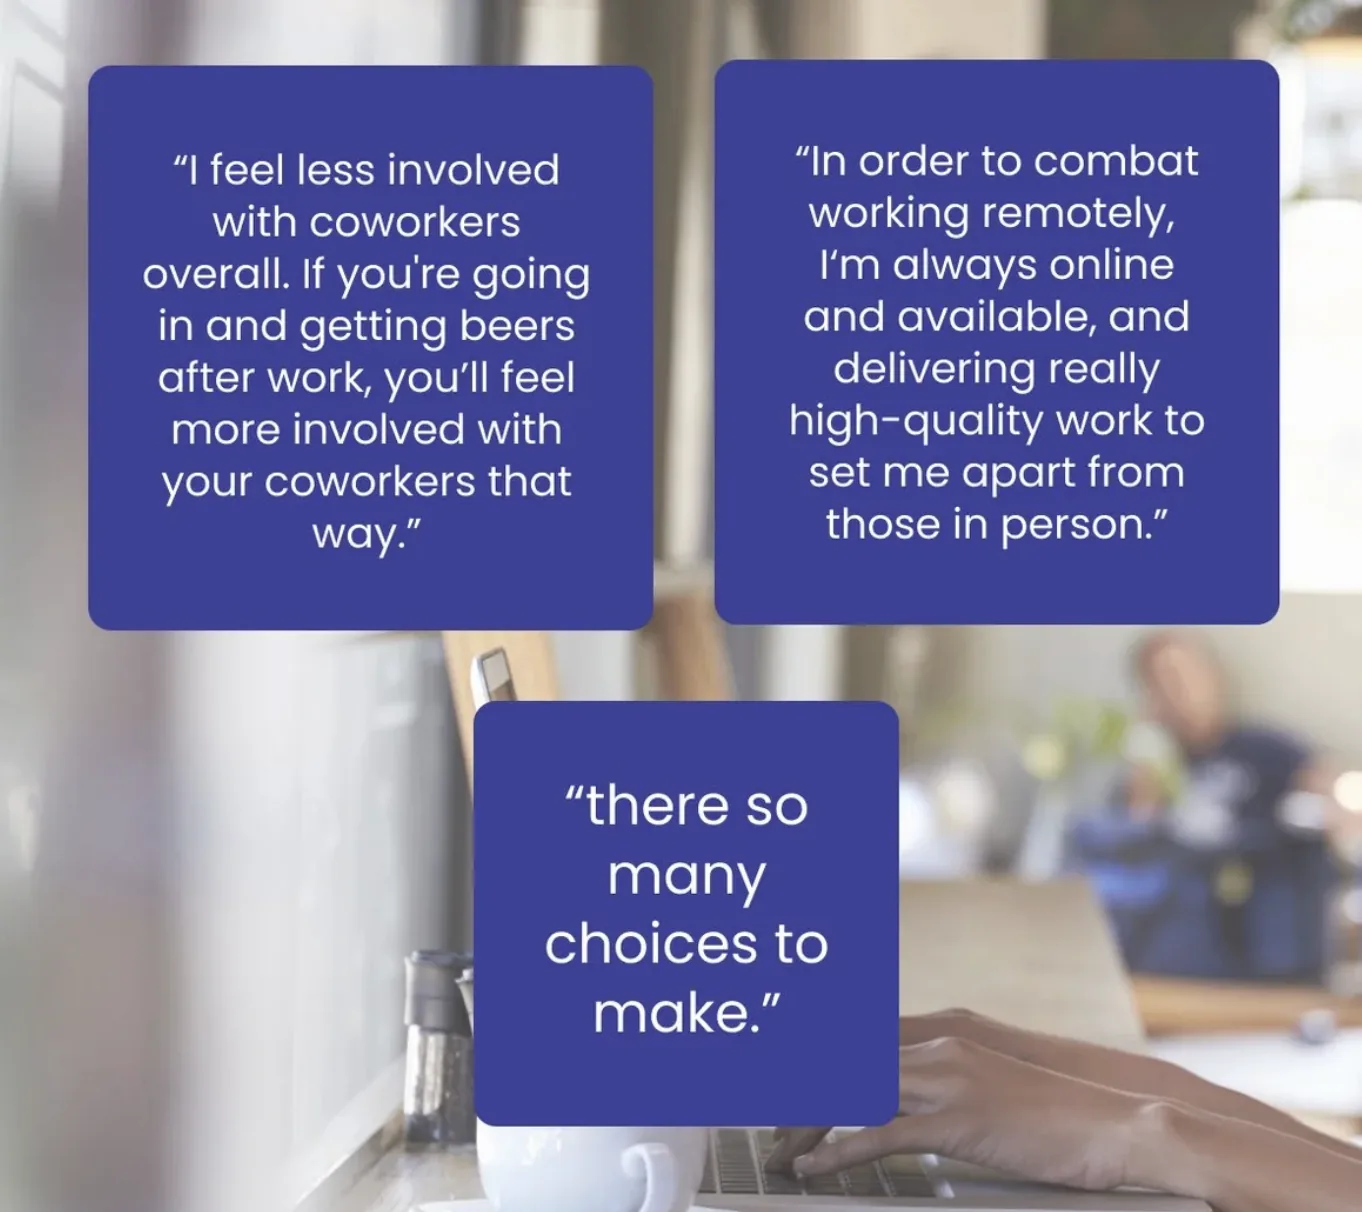
Three recurring themes from nomad interviews: social disconnection, overcompensation at work, and decision fatigue
Affinity Mapping
488 notes from surveys and interviews clustered into four themes, and the largest was barriers: career, health, budgeting, and a lack of helpful information.
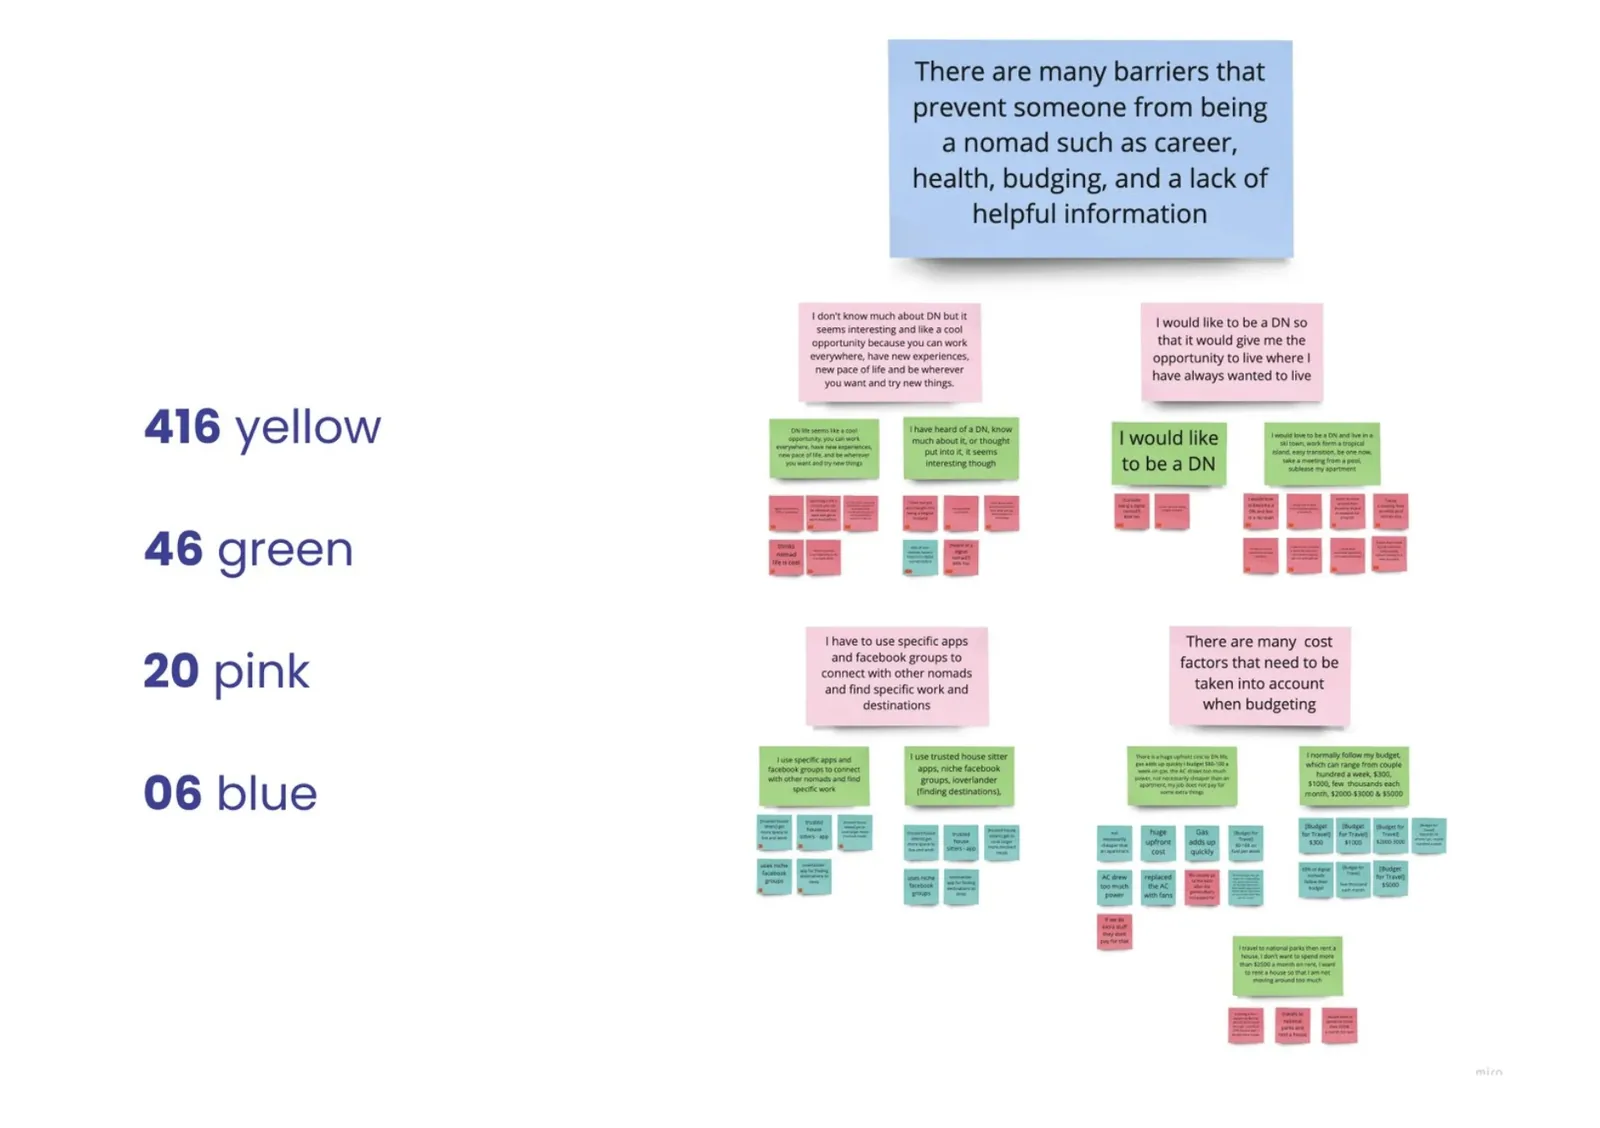
416 yellow, 46 green, 20 pink, and 6 blue notes synthesized into four major theme clusters
From insight to idea
Two personas anchored the ideation phase, turning abstract insights into specific, human problems. From there, ideation, competitive analysis, and two distinct concepts were tested against those needs before converging on a final direction.
Personas
Two personas carried the research into design: an aspiring nomad who needs structure to start, and an active nomad worn down by planning.
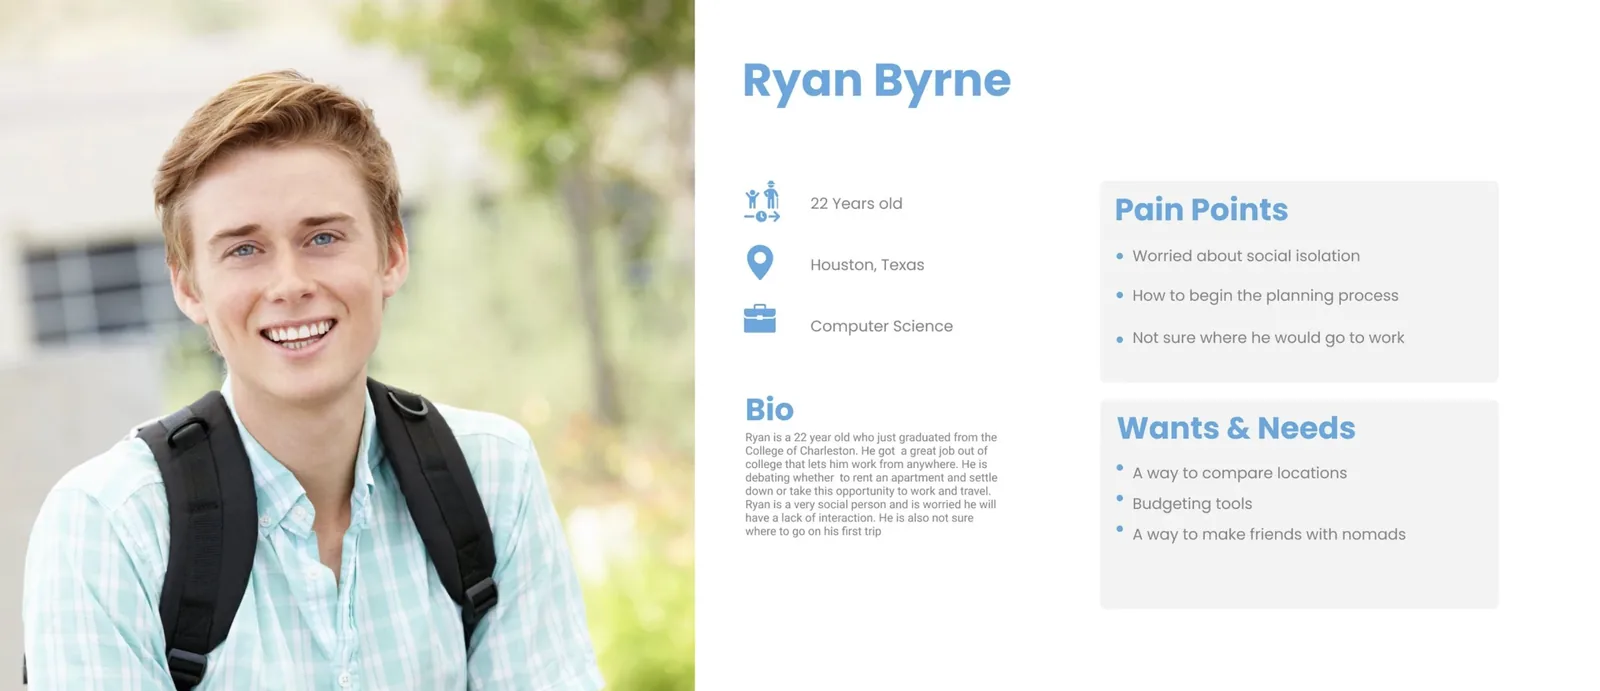
Ryan Byrne, 22, Houston: wants to take the leap but needs structure, budget tools, and community
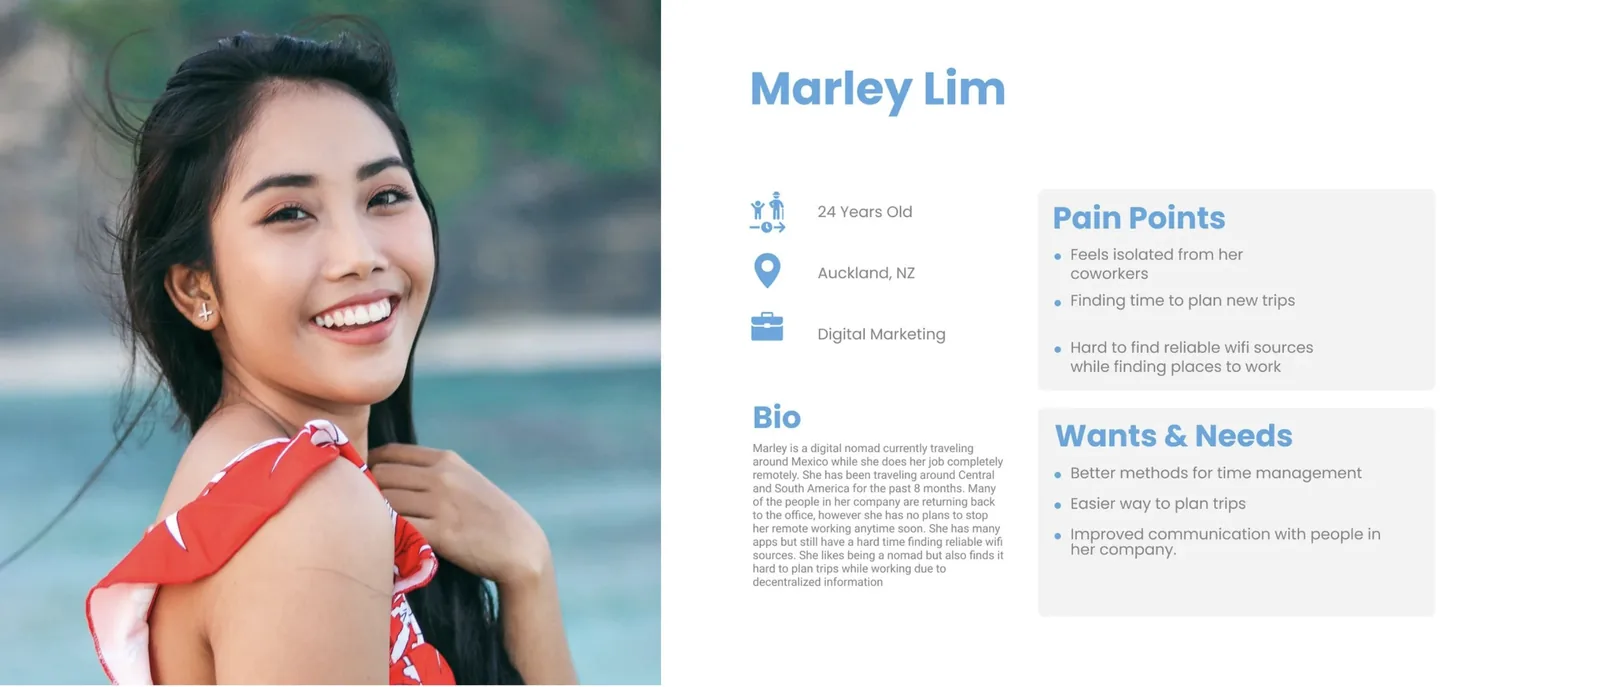
Marley Lim, 24, Auckland: active nomad fighting isolation, overwhelmed by planning each new move
Marley's Experience
A scenario walkthrough with Marley revealed exactly how the pain points stack in real life: six months into a Mexico stay she is traveling alone and looking for people to travel and work with, the app she tried for meeting people turned out to be about dating, she procrastinates planning because it is overwhelming, and her travel documents are scattered across emails and texts.
How Might We
The research condensed into six How Might We statements before narrowing to one.
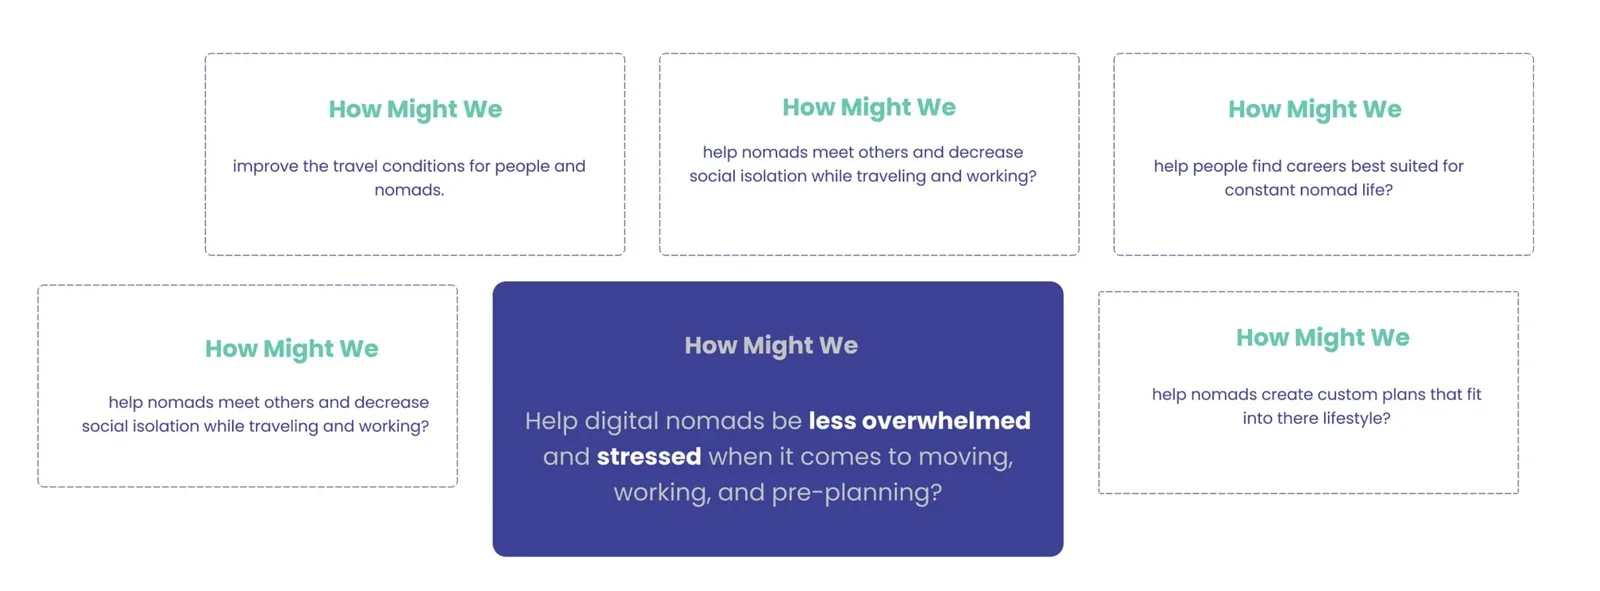
Six HMW statements narrowed to one core opportunity: reducing overwhelm and stress across moving, working, and planning
Competitive Landscape
The market was mapped across budgeting, workspace, planning, and connecting, and the target position was marked where planning meets connecting.
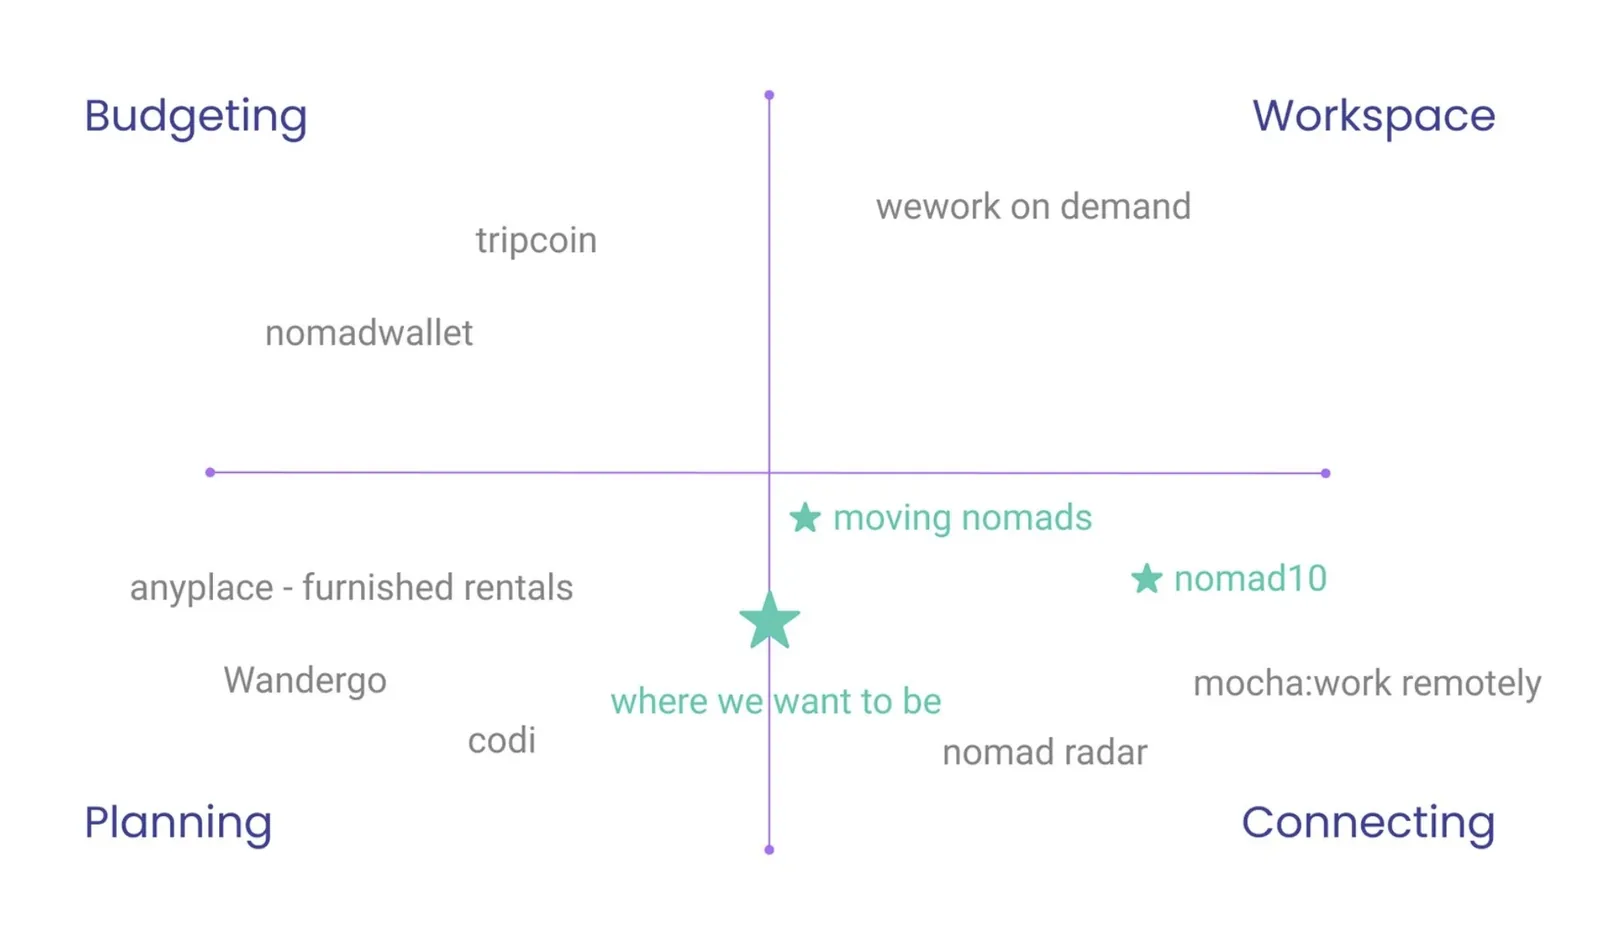
Competitors map to Budgeting, Workspace, Planning, and Connecting, and a star marks where we want to be, between planning and connecting
Two Concepts
Ideation across the four insight areas produced two competing concepts: one planning forward, one community first.
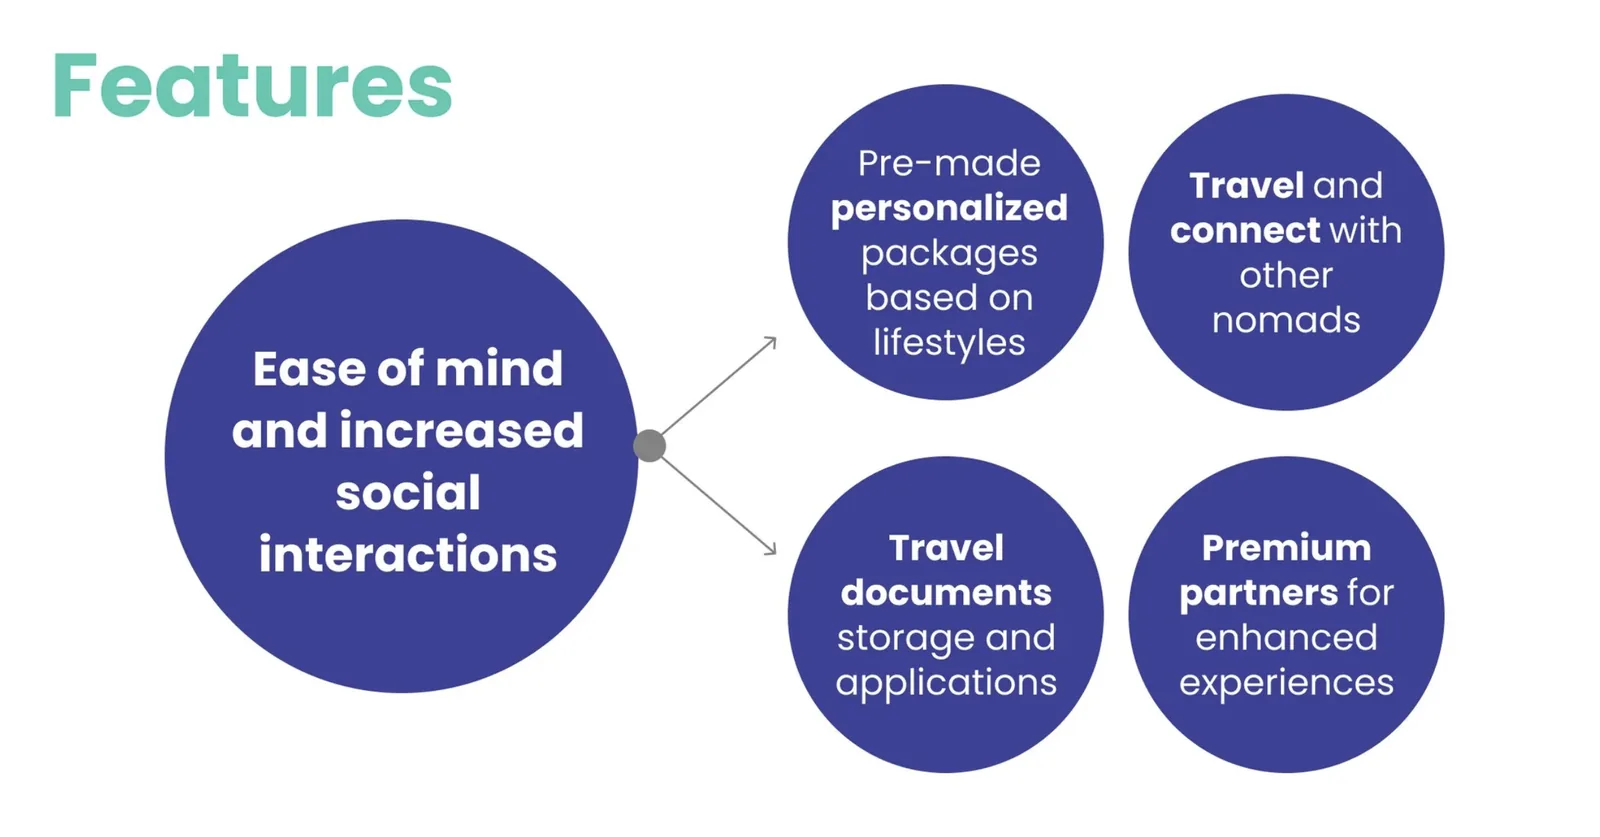
Concept 1 features: personalized packages, social connection, document storage, and premium partner access
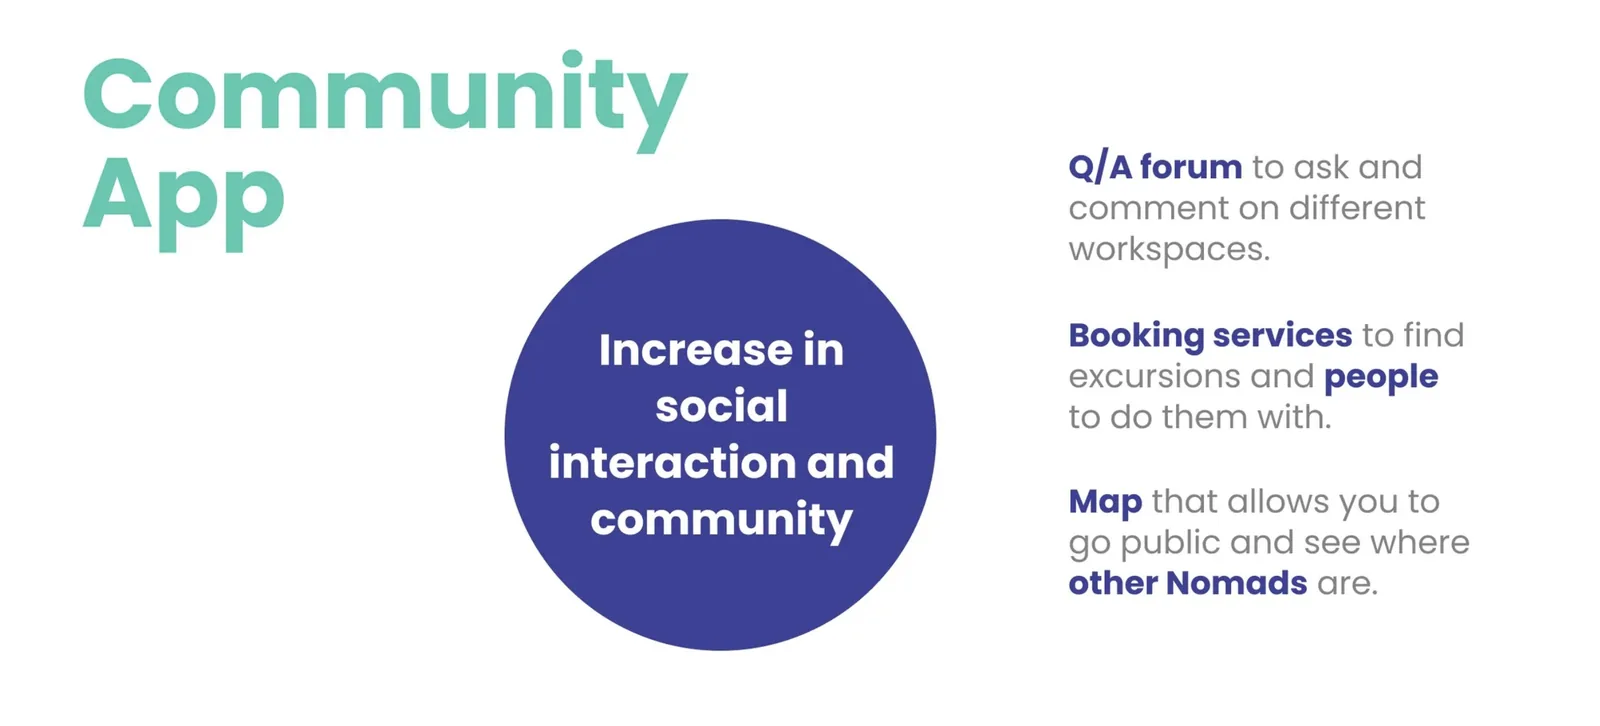
Concept 2: a community first app centered on reducing isolation through shared maps, forums, and booking
Convergence
Compared side by side, both concepts were answering the same two problems, so they merged.
The two concepts merged: less travel agency, more connection and local planning
Feature Definition
The merged concept came down to five core features: a public nomad map, close by places to work, free events other nomads attend, group excursions, and in app connection.
Building the platform
With the concept defined, the team moved into branding, information architecture, and high fidelity screens. A user scenario with Rory validated the experience end to end before prototype testing began.
Rory's Story
Before any high fidelity screens were built, a narrative scenario was used to pressure test the concept against real human behavior. Rory, a new user landing in an unfamiliar city, was walked through the full Explorius experience from discovery to booking to connection. The scenario was designed to expose gaps in the architecture before any visual work was at risk.
Branding
The identity pairs Poppins with a four color palette of lavender, teal, sky blue, and light gray.
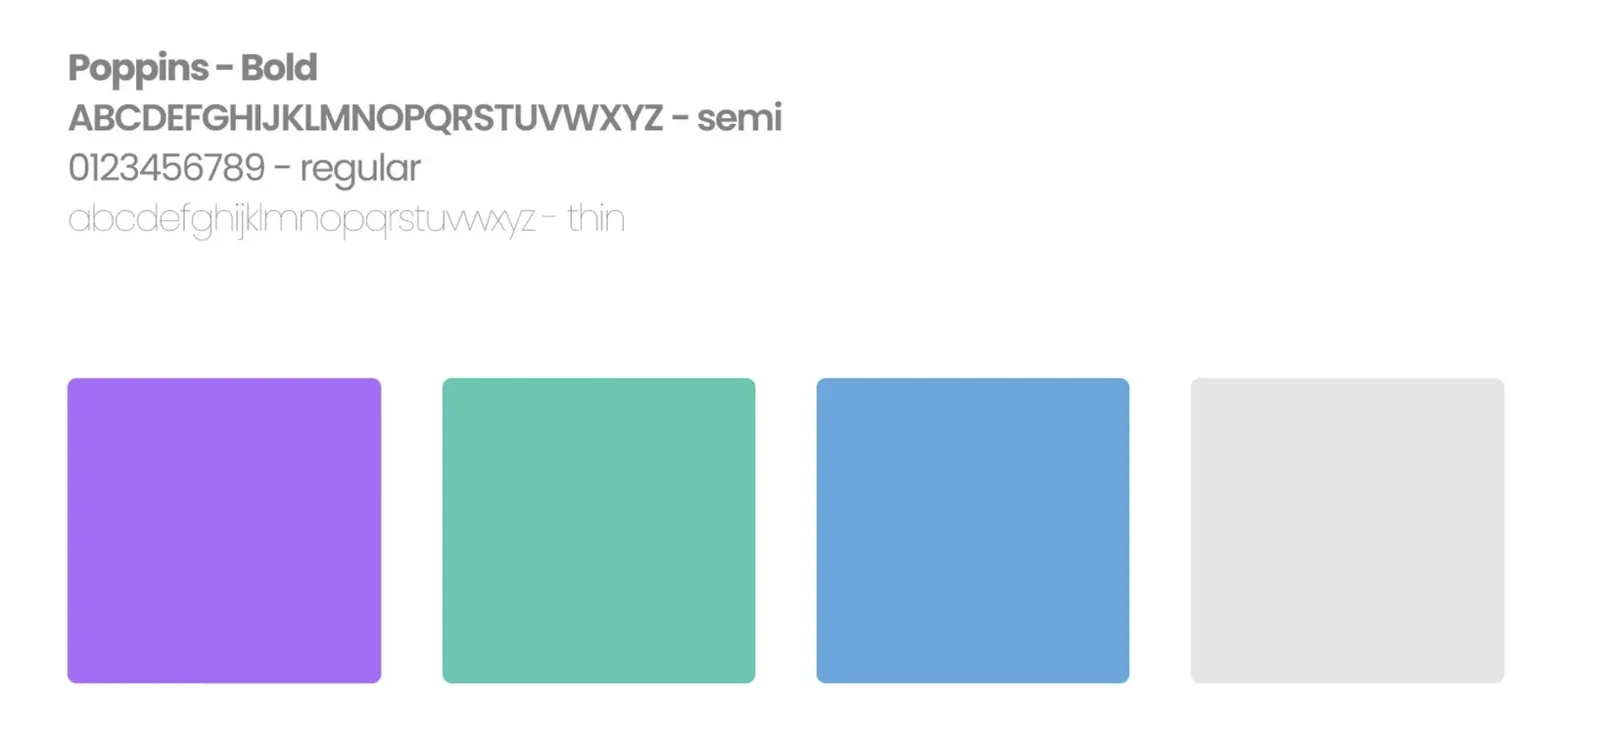
Poppins typeface paired with a warm, approachable palette of purple, teal, blue, and gray
Concept Validation
Card sorting, 20 open sorts and 10 closed, validated the mental model before any architecture was drawn.
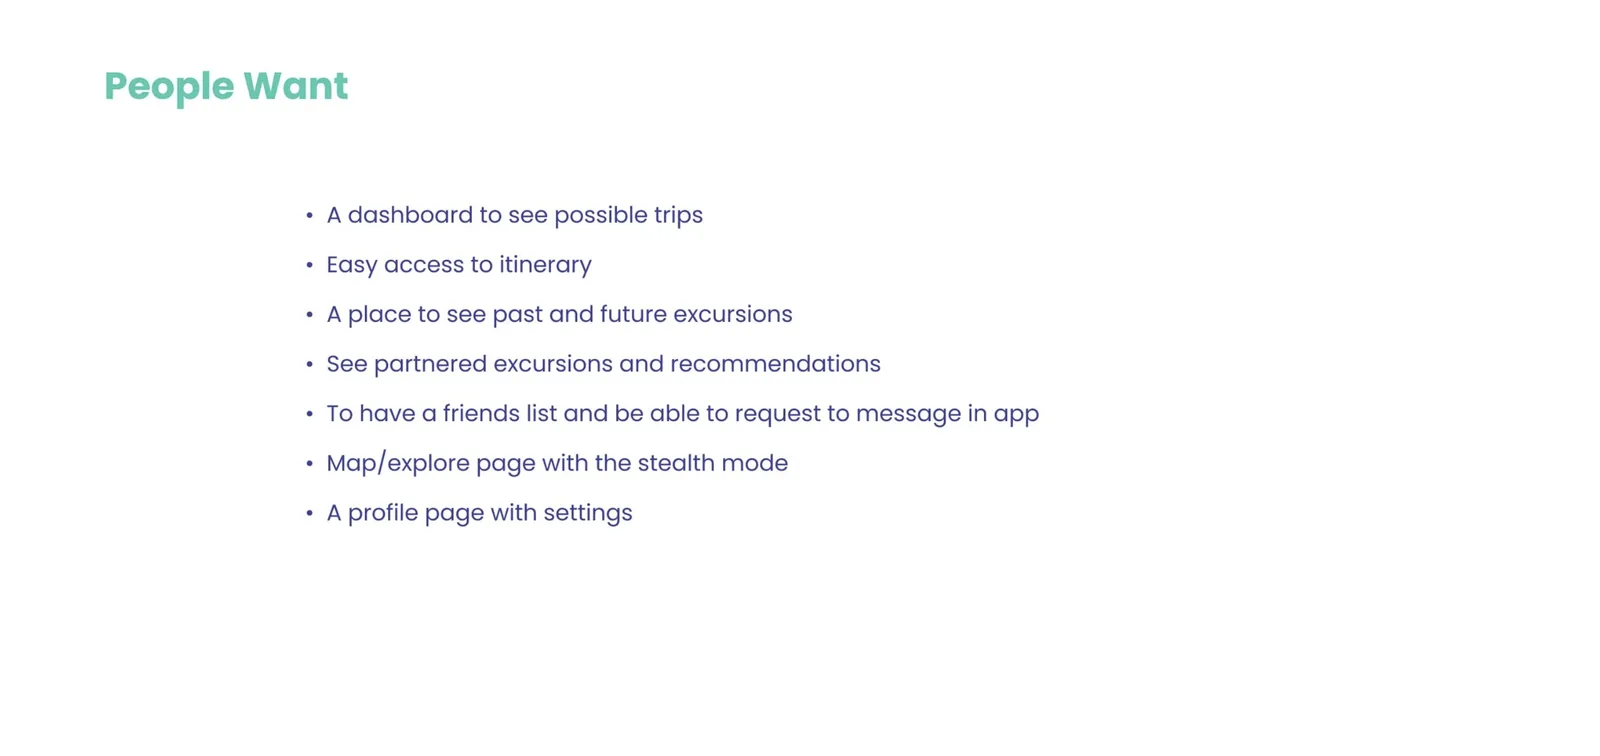
Seven clear wants emerged from card sort sessions, directly shaping the information architecture
Site Map
The validated groupings became a five section architecture.
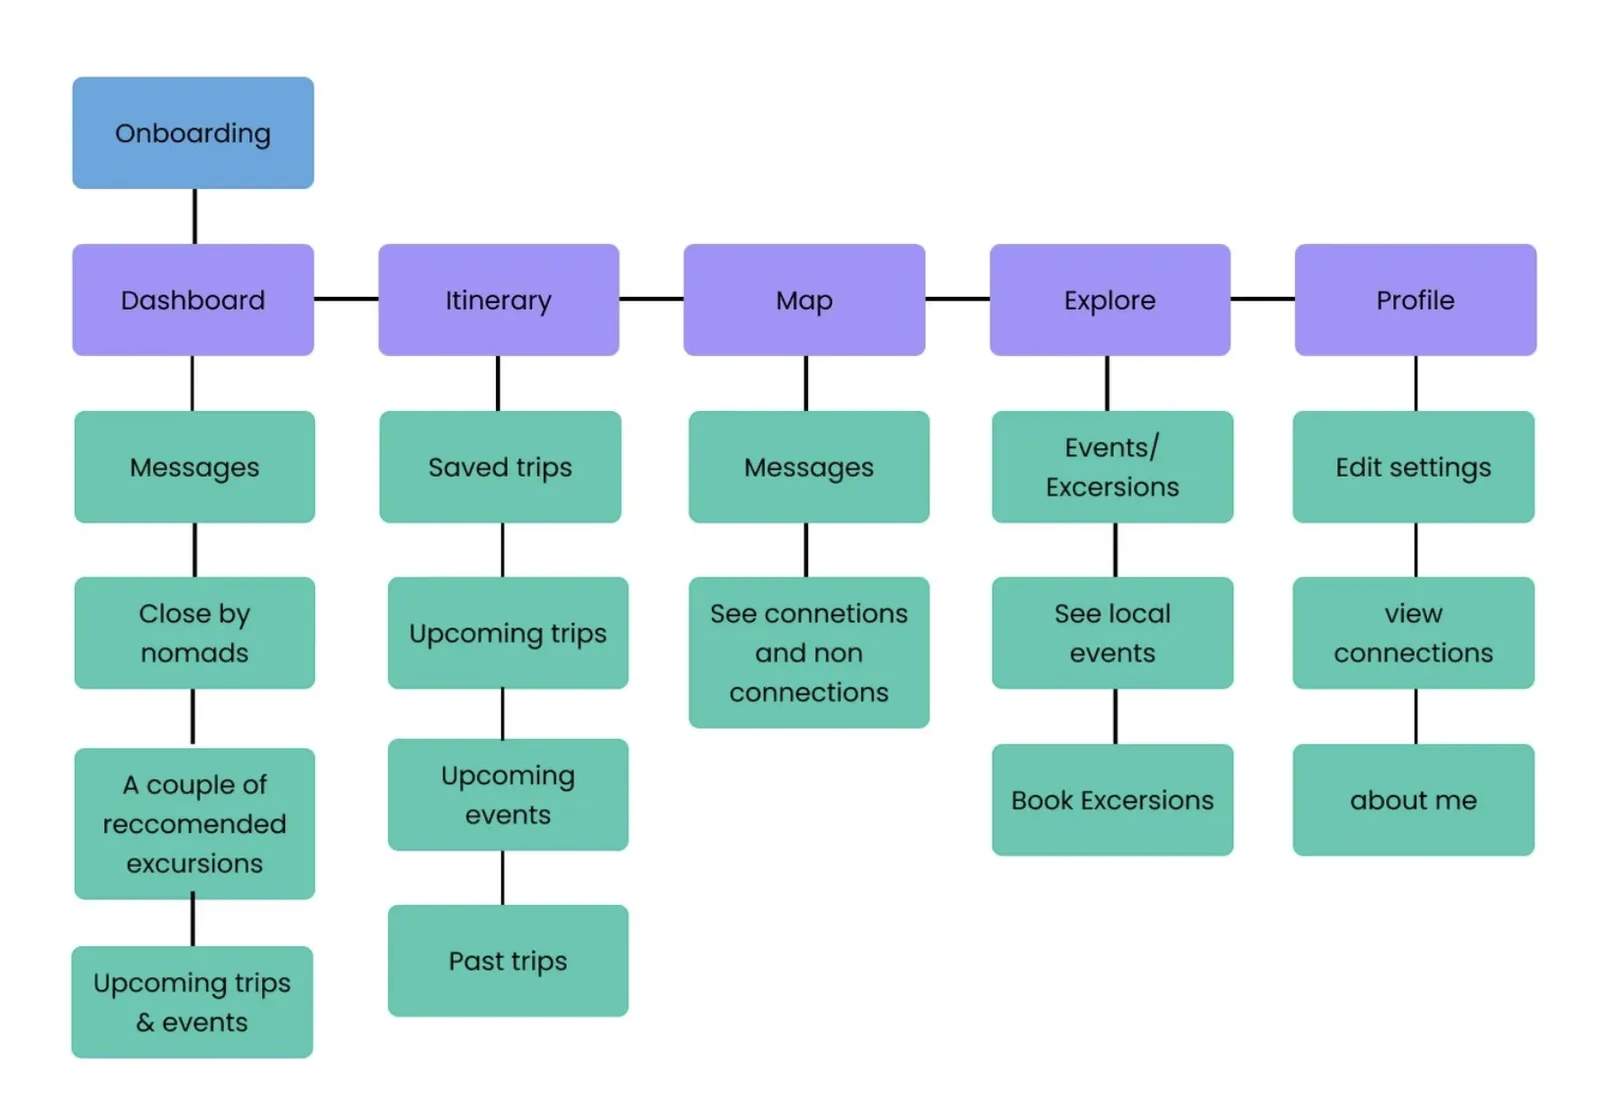
Five section architecture: Dashboard, Itinerary, Map, Explore, and Profile, anchored by Onboarding
High Fidelity Screens
With the architecture validated, screens were built across all five sections of the app. The six below map to the decisions that defined the product.
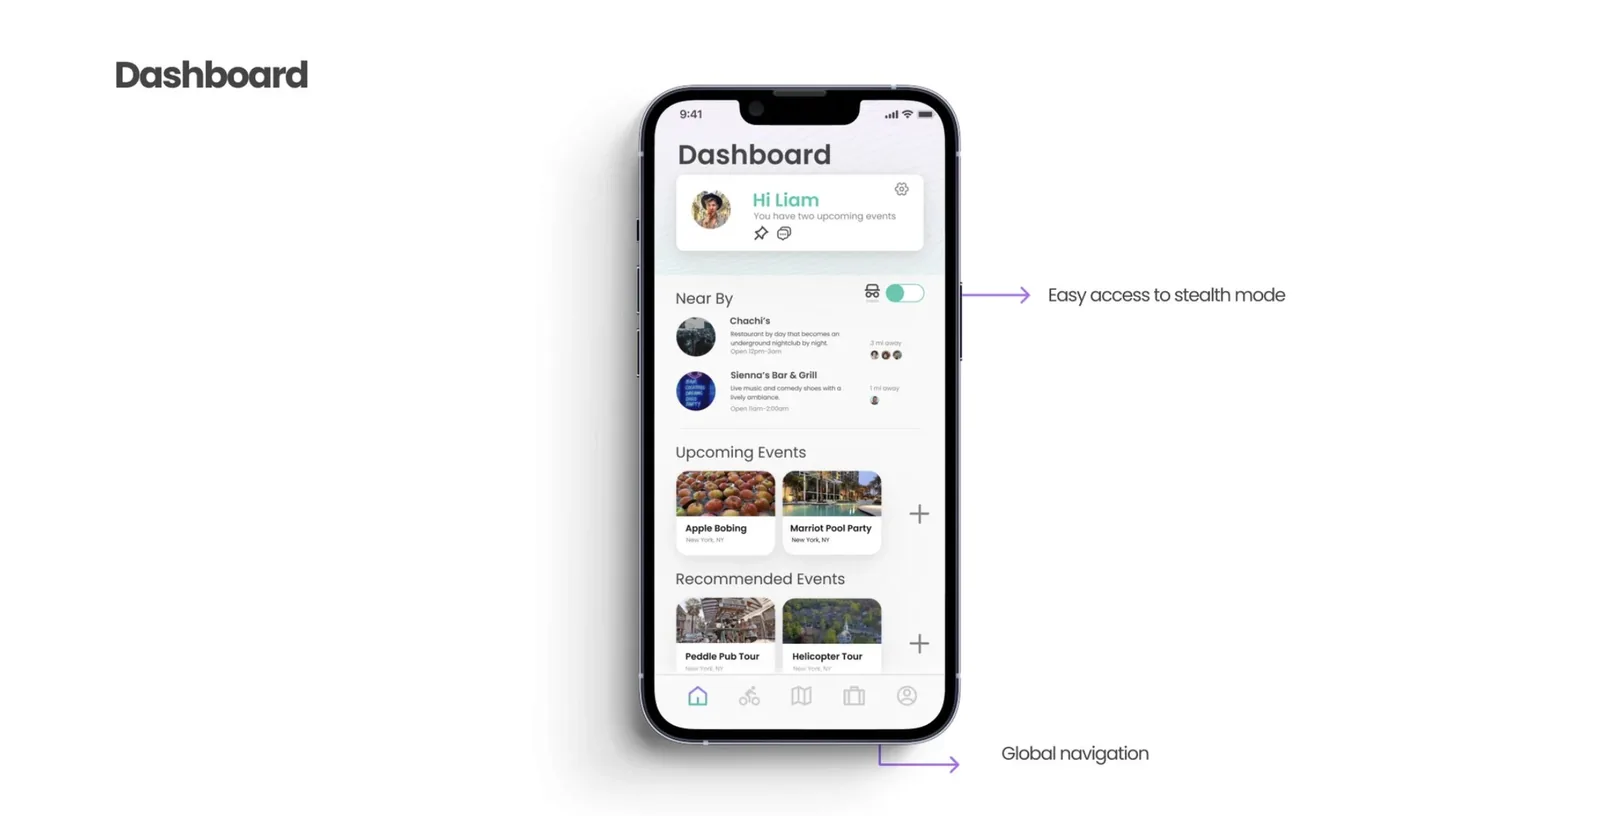
The Dashboard is utility first: nearby places, upcoming events, and a one tap stealth mode toggle
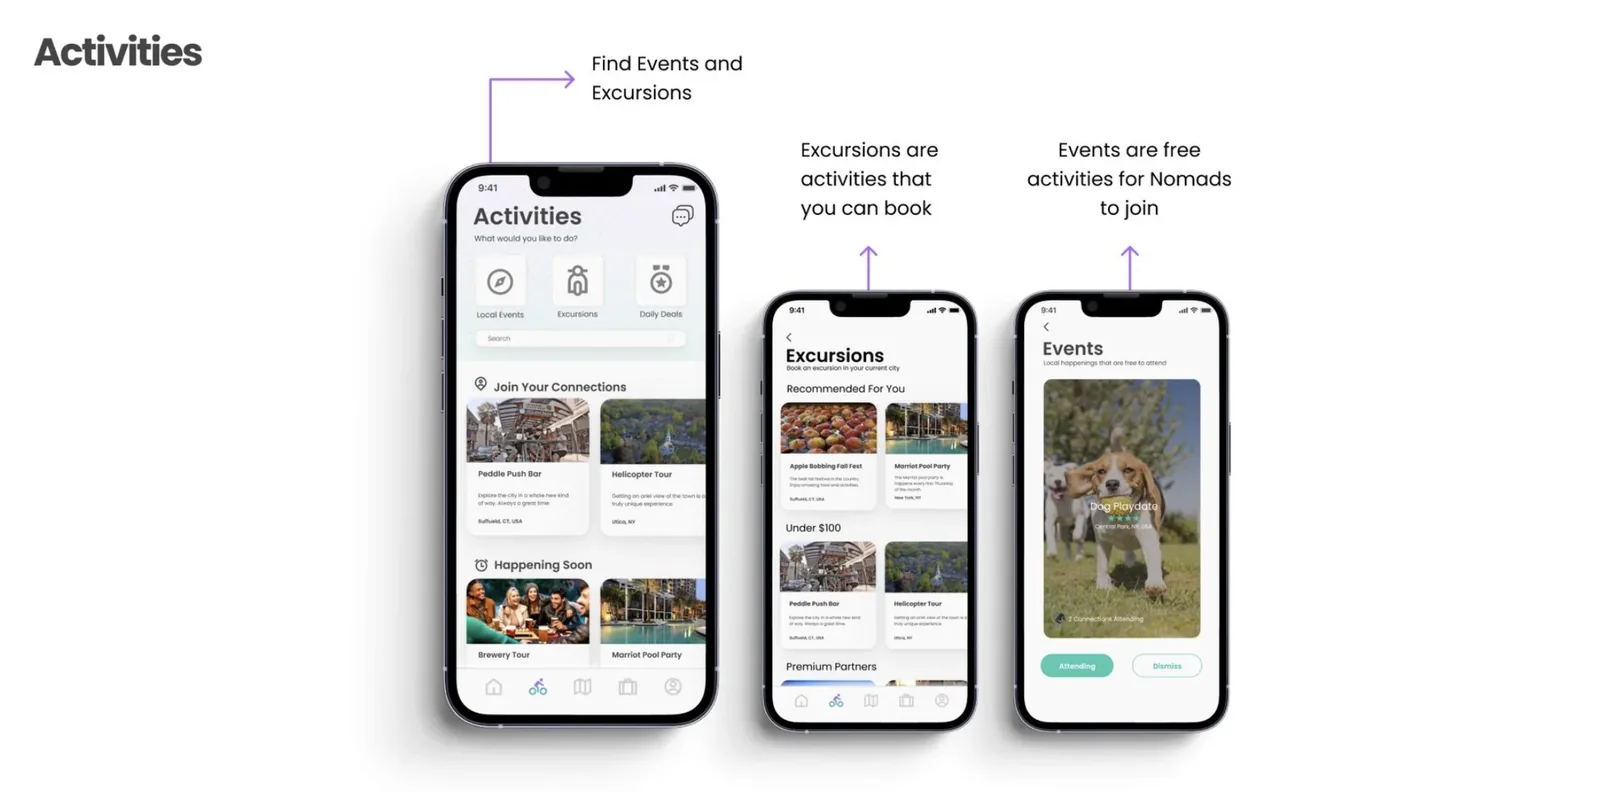
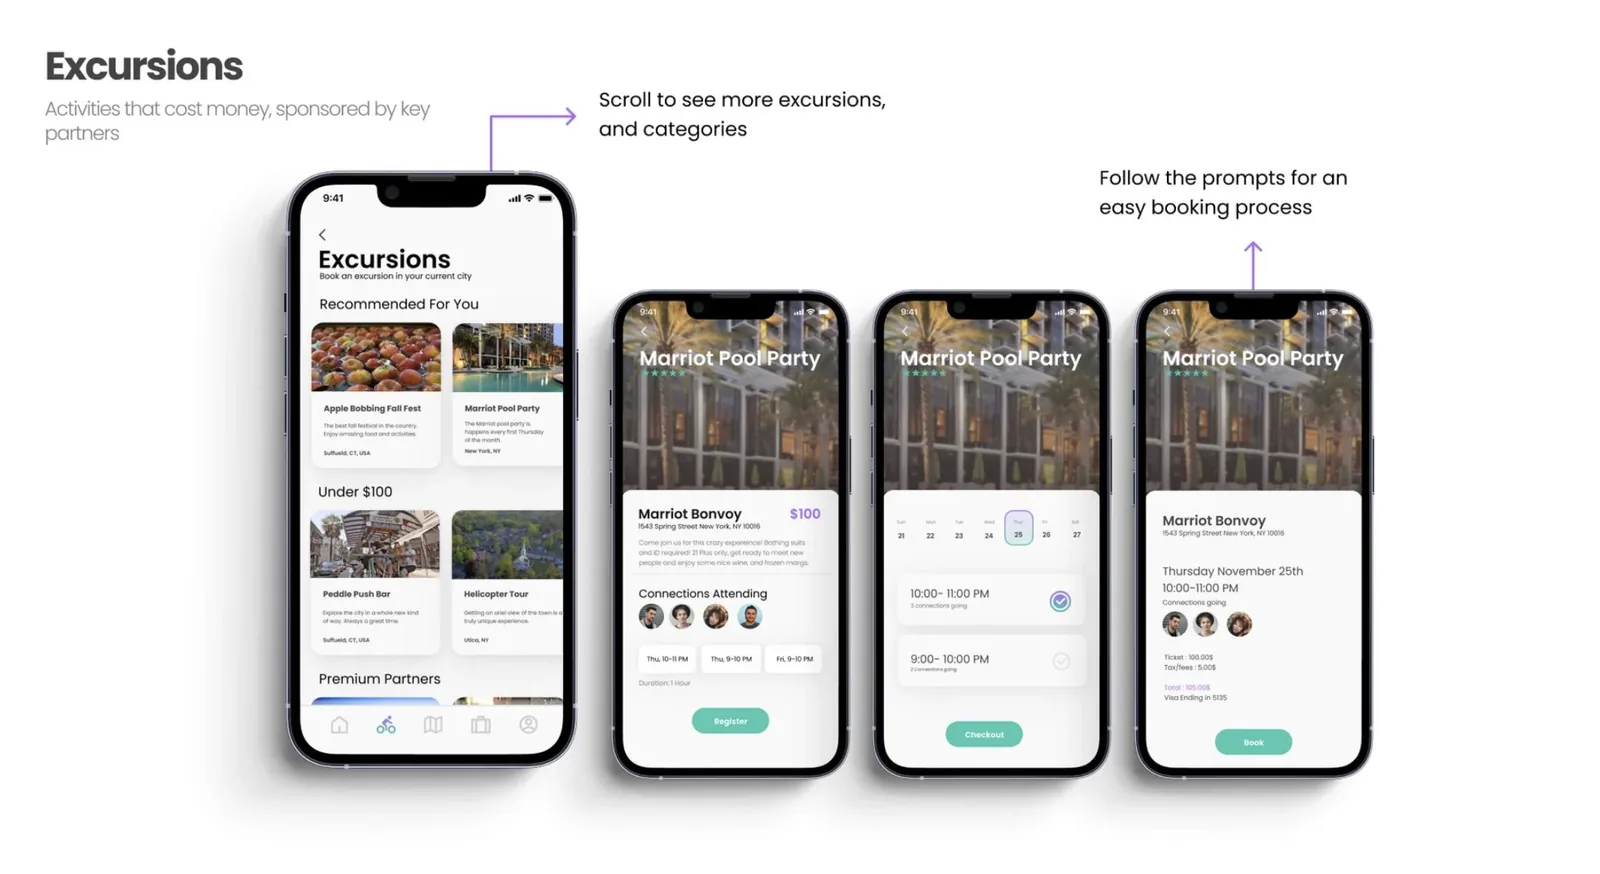
Events and Excursions live in separate tabs, and Book Now sits one tap from the excursion card
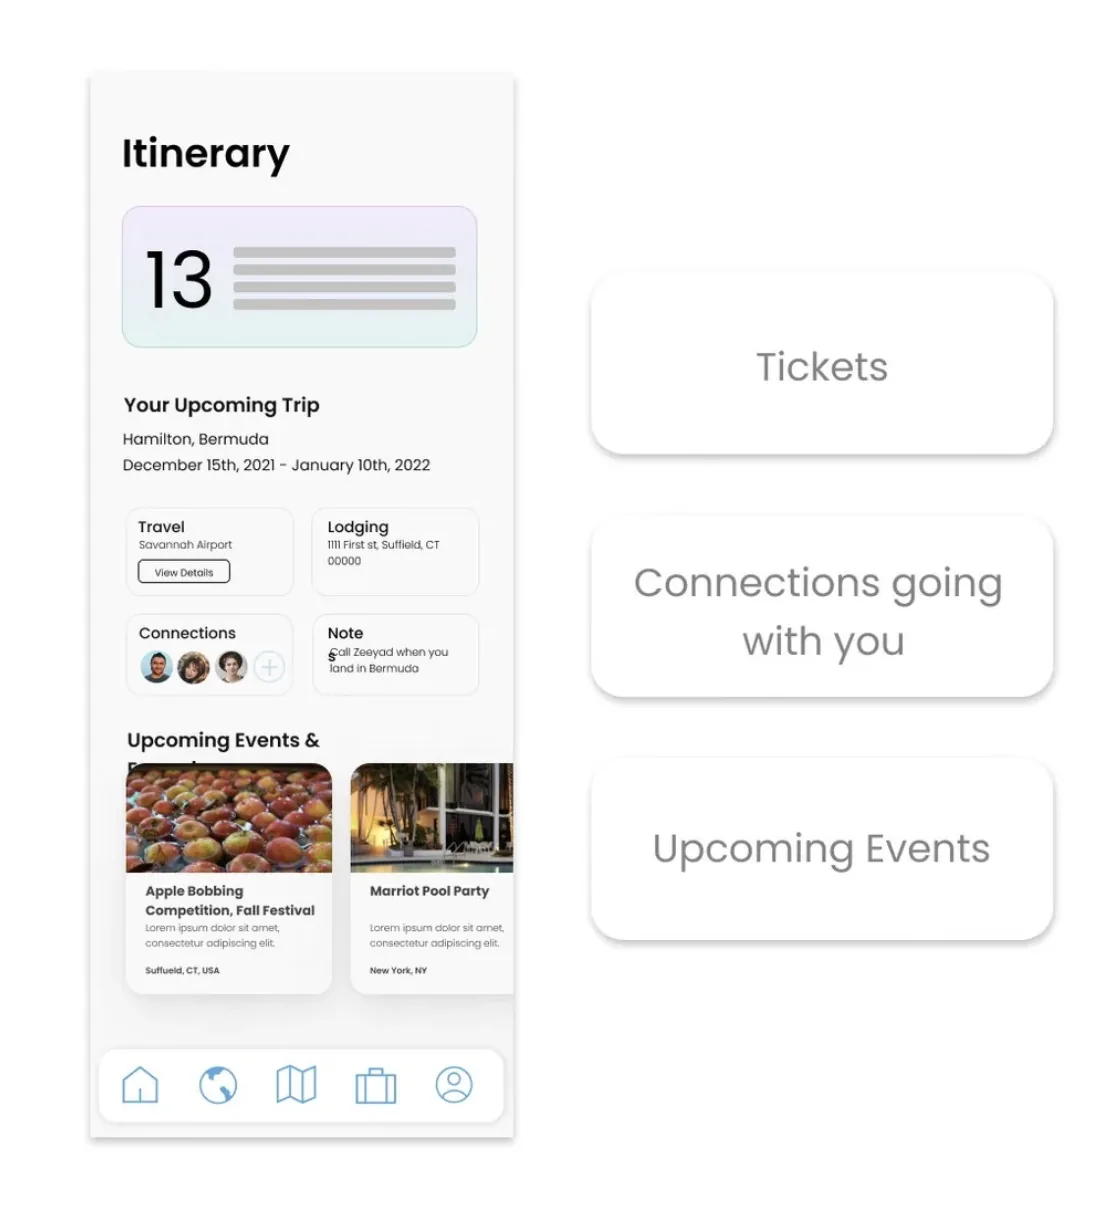
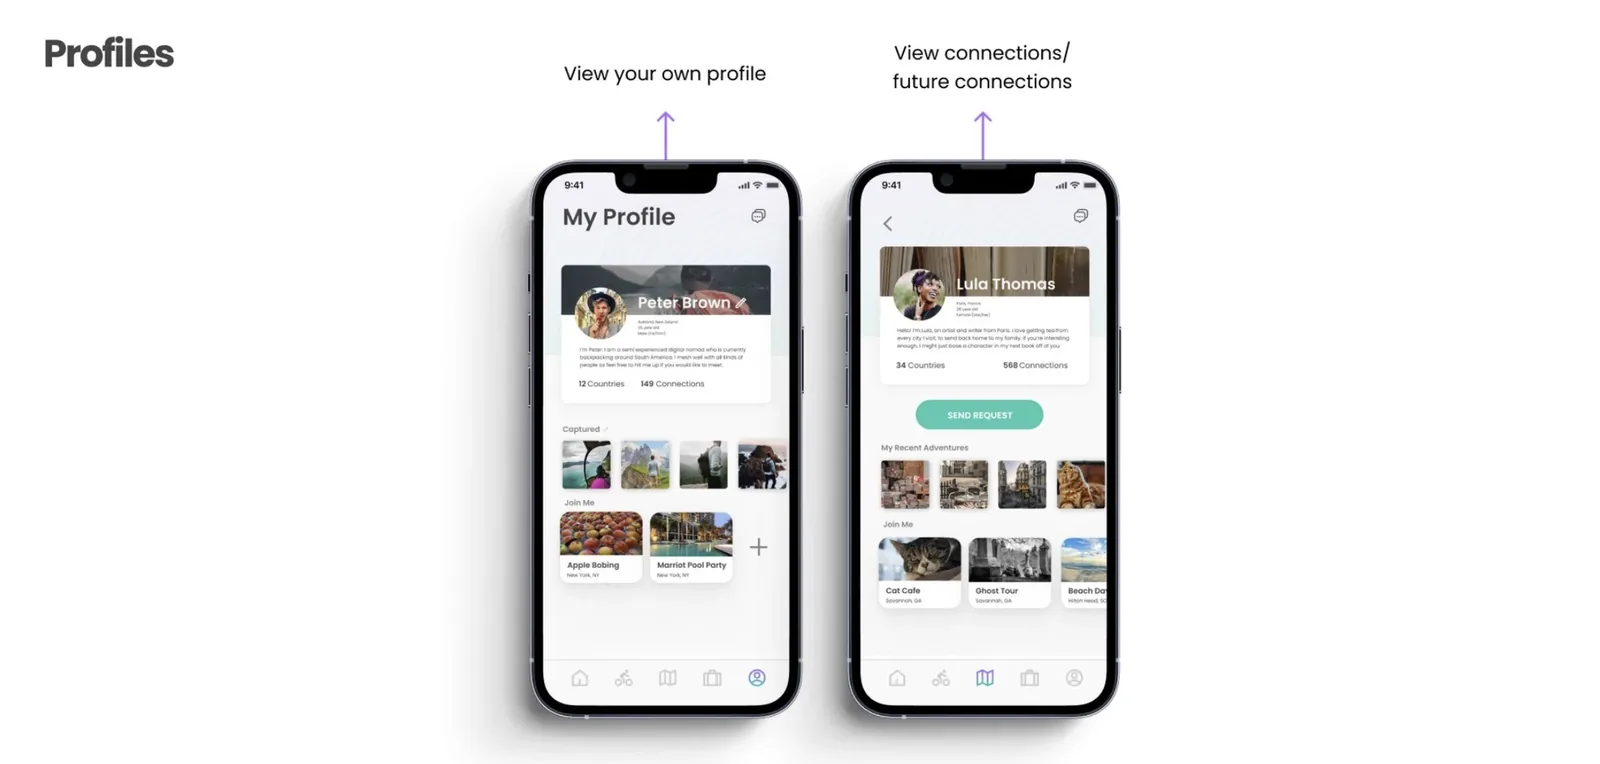
Travel plans and documents live inside the trip, and profiles lead with connections
Why Explorius works the way it does
Four decisions defined the character of the product. Each one came directly from something a real user said or did during research or testing.
Research showed that nomads wanted control over when they were discoverable. Making yourself public needed to feel like a conscious choice, not a default. Stealth mode was not a privacy feature added at the end. It was a trust mechanism built into the product from the first wireframe, because users would not engage with the social layer unless they felt safe doing so on their own terms.
The first Dashboard iteration used recommendation carousels. User testing showed carousels felt passive and unhelpful. Nomads in a new city do not want to browse, they want to act. Replacing carousels with four utility modules, Close by Nomads, Recommended Excursions, Upcoming Events, and Notifications, turned the Dashboard from a suggestion surface into a tool users opened with purpose.
The original Explore tab combined Near You and Destinations in a single view. Users in testing could not articulate the difference between them, which meant neither was useful. Separating Events (free, spontaneous, social) from Excursions (bookable, structured, cost based) gave each category a clear identity and made the path to action obvious for both types of user intent.
The original navigation used abstract icons, a pentagon, a telescope, a social graph, that tested poorly because users could not predict what they would find behind each one. Unpredictable navigation creates anxiety in an app built for people already managing high logistical stress. Switching to universally recognizable symbols, home, globe, map, luggage, profile, removed that friction entirely and reduced the learning curve to zero.
Testing what we built
Lo fi prototypes were tested with users across the core screens, generating direct feedback on navigation clarity, information hierarchy, and feature usefulness. Each round produced targeted changes before the next iteration.
Explore
The first Explore combined Near You and Destinations in a single view.
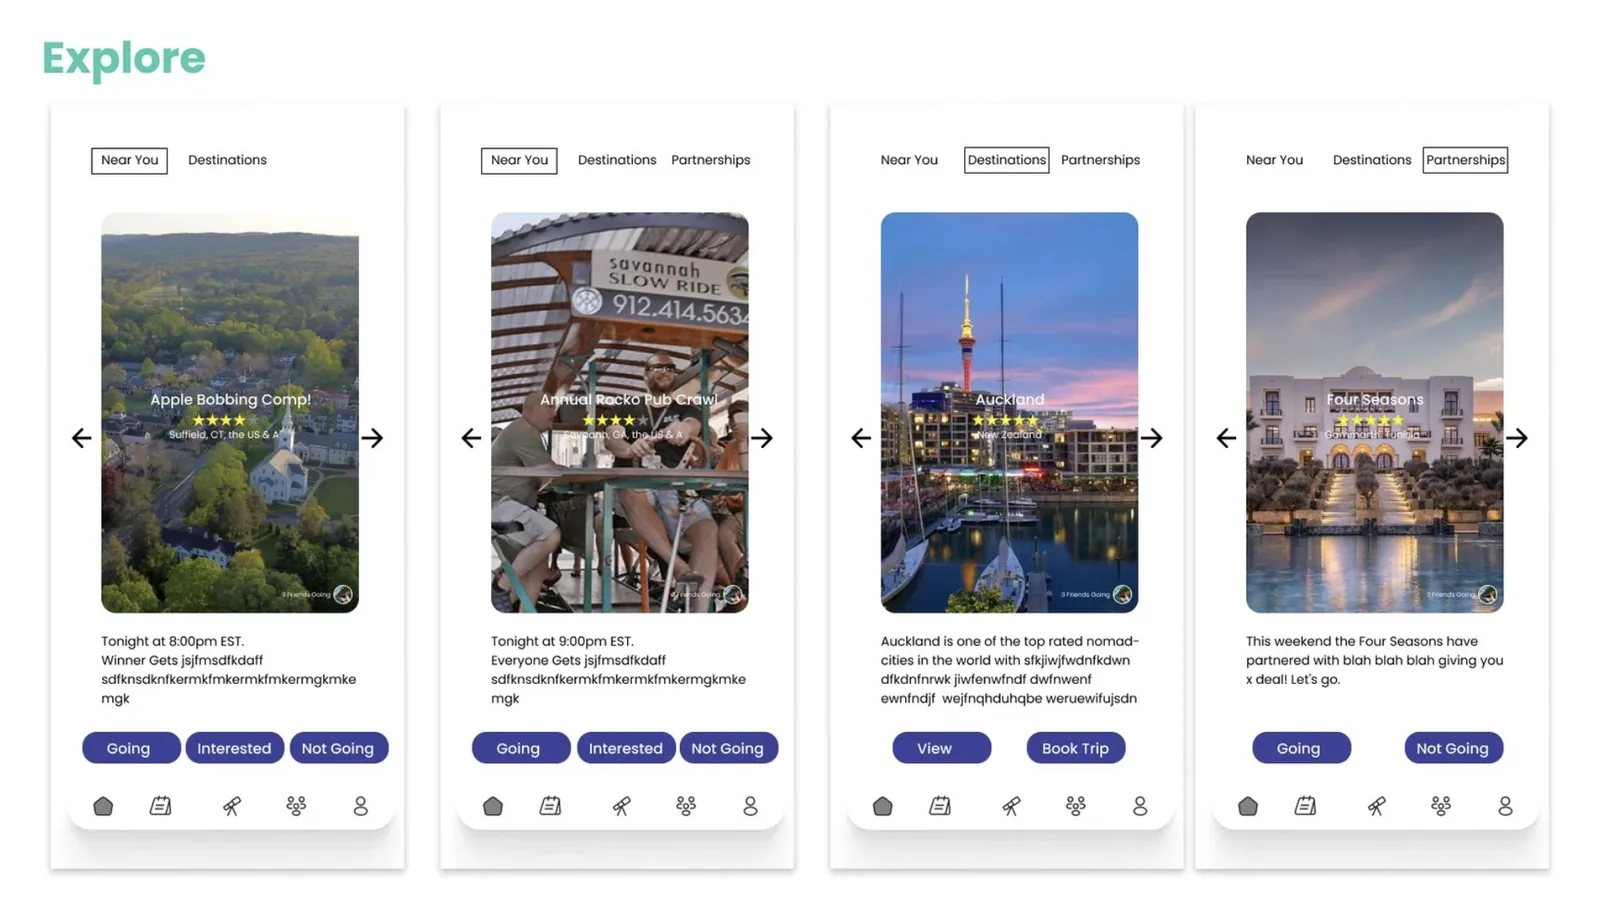
Initial lo fi Explore screens tested the Near You, Destinations, and Partnerships tab structure
We needed a difference between Near You and Destinations. What is the difference?
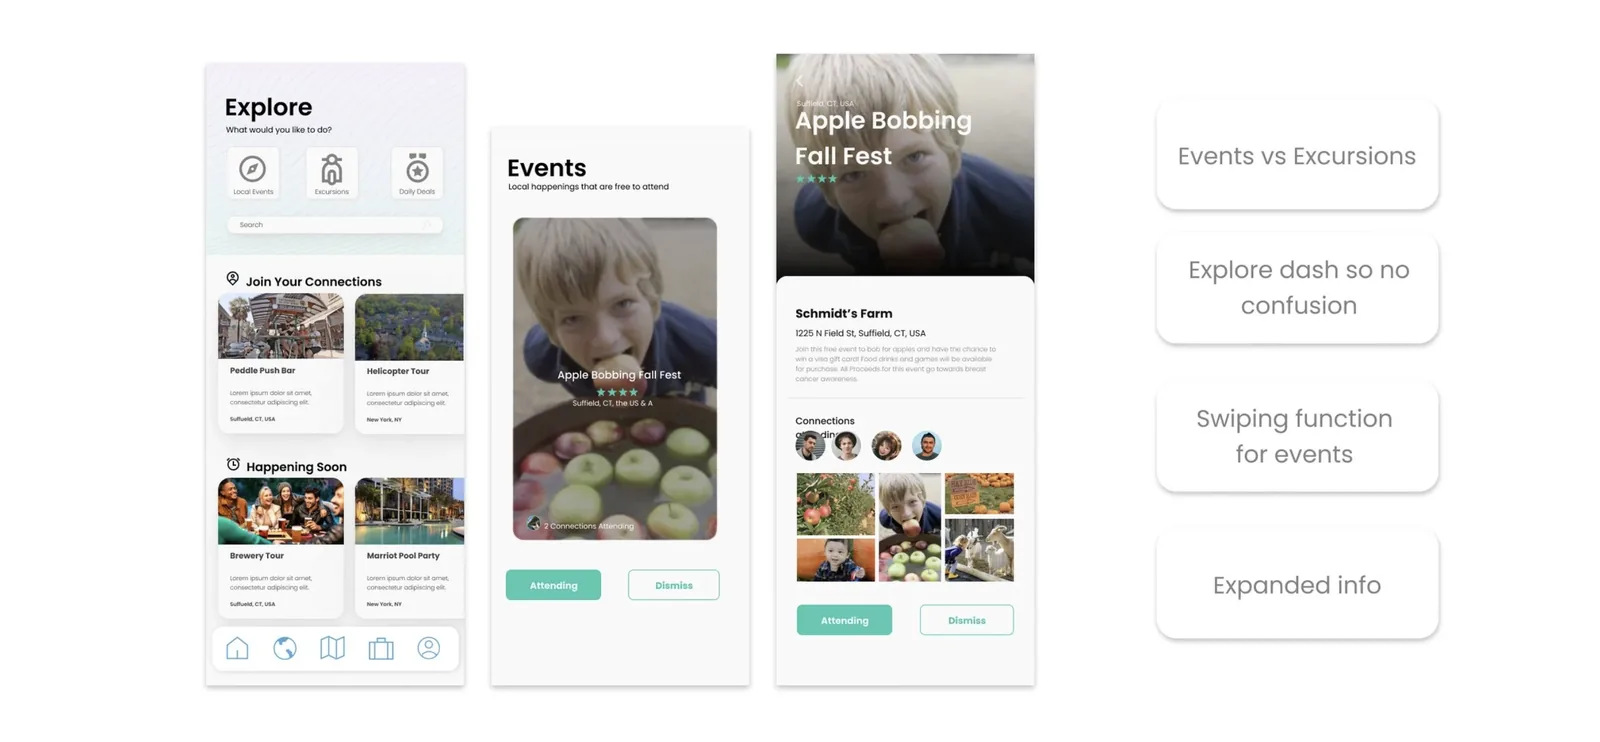
Explore update: Events and Excursions separated, an Explore dashboard added to remove confusion, swiping for events, and expanded info
Dashboard
The first Dashboard bet on recommendation carousels.
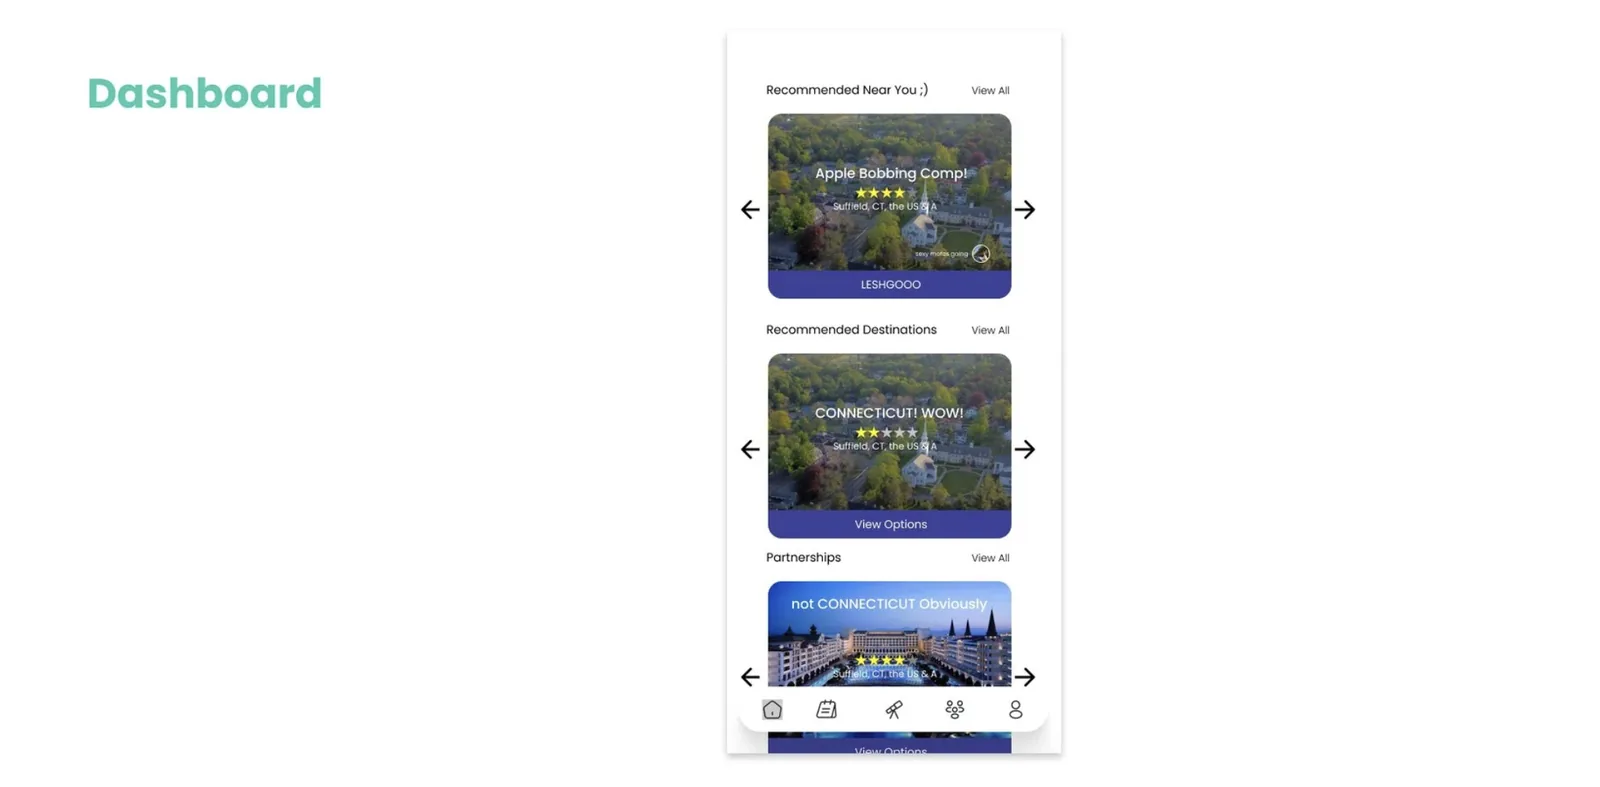
Initial lo fi Dashboard tested carousel based content recommendations
The dashboard was not so useful, and they want more utilities.
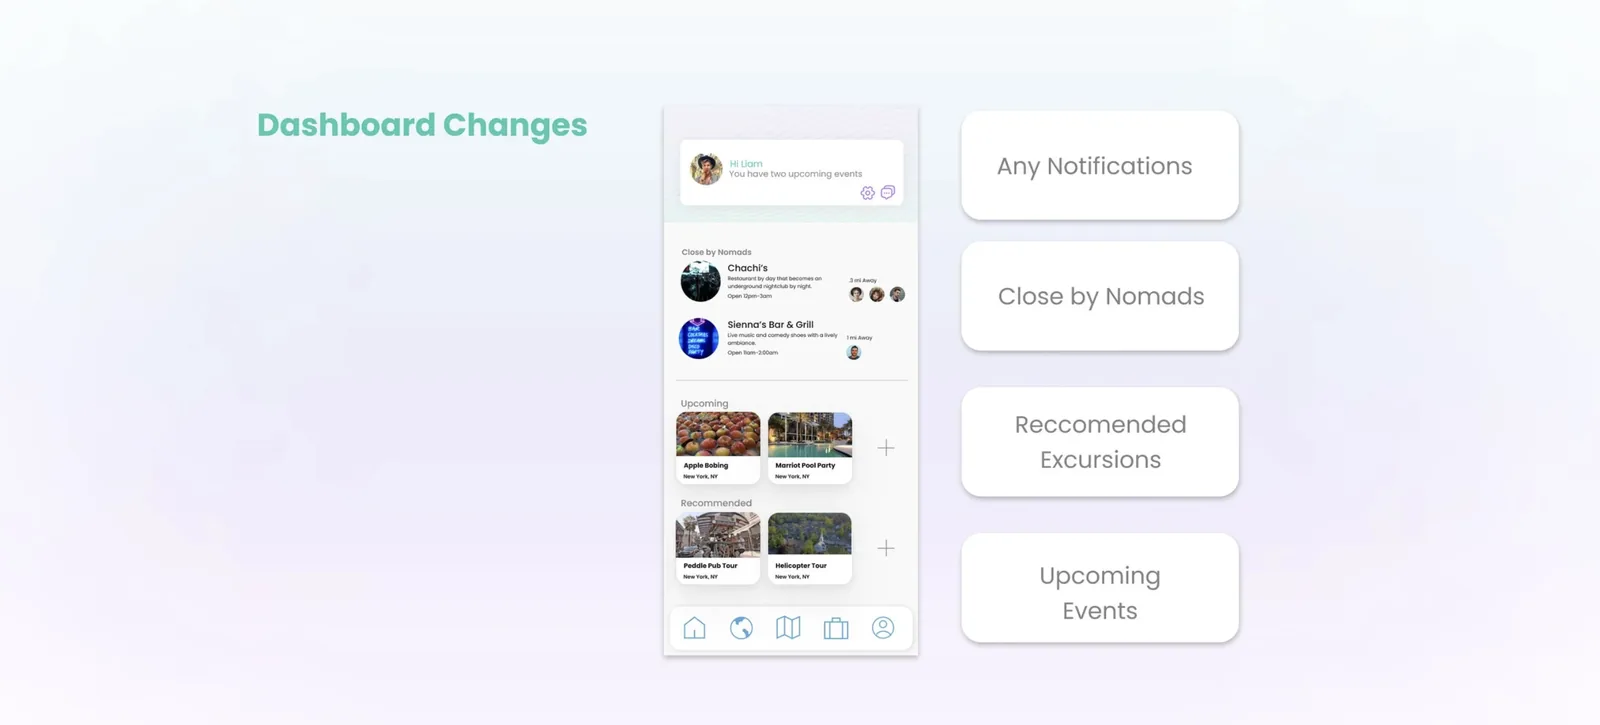
Dashboard redesigned around four utility first modules: Notifications, Close by Nomads, Recommended Excursions, Upcoming Events
Navigation
The first navigation bet on abstract icons.
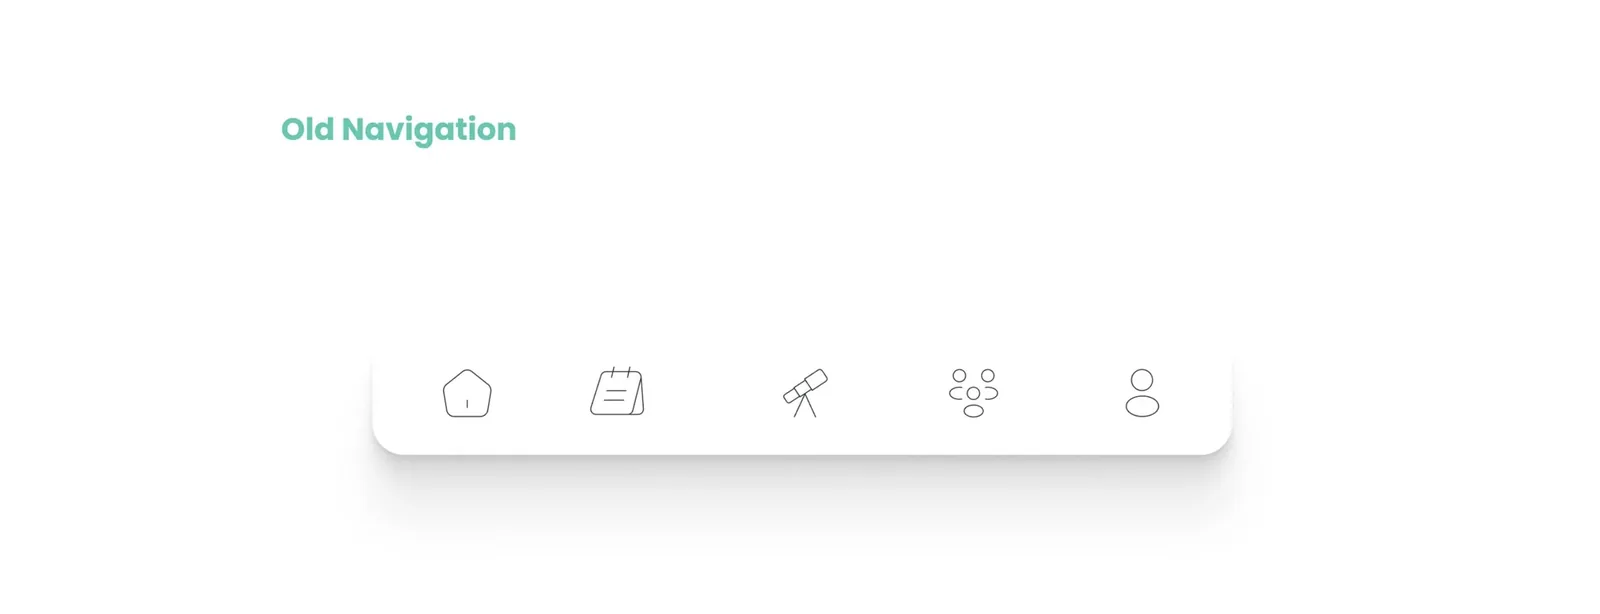
The original set: a pentagon, a notepad, a telescope, a social graph, and a circle
Navigation was tricky.
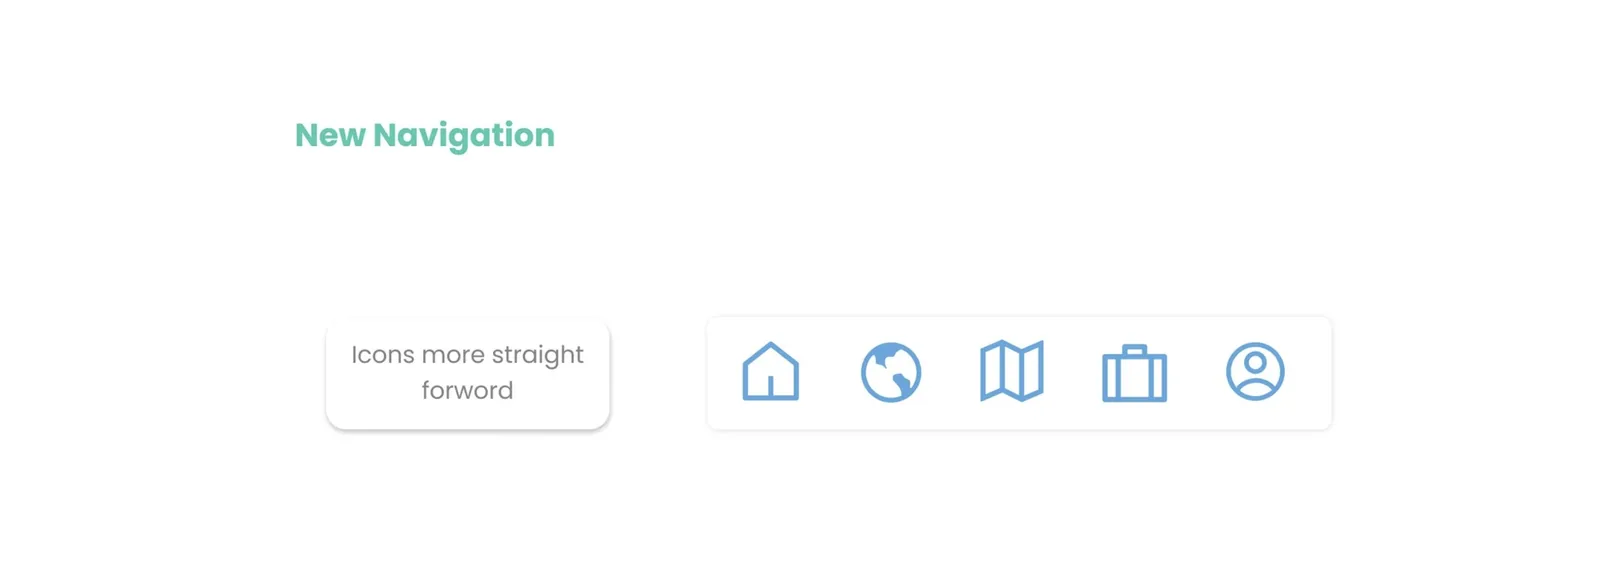
Navigation icons replaced with universally recognizable symbols, resolving the learnability issue
Key Testing Insights
Users could not distinguish Near You from Destinations. Separating Events and Excursions into distinct tabs resolved the confusion immediately.
A recommendation carousel felt passive. Users wanted actionable widgets: nomads nearby, upcoming events, and real time notifications.
Abstract icons created unnecessary cognitive load. Switching to universally recognizable symbols removed the friction entirely.
Book Now needed to be more prominent and accessible. Reorganizing excursion detail pages made the path to booking faster and clearer.
A platform ready to launch
Over 14 months, Explorius moved from a research question about nomad pain points to a tested, high fidelity mobile platform with a validated information architecture. In user testing, every navigation change reduced task completion time. The Dashboard redesign produced the strongest positive response of any single change across all testing rounds, with users describing it as the first time a travel app felt like it was actually built for how they work. The competitive gap identified in research, no product combining deep planning with active social connection, remained unoccupied by any existing app at project close.
60% of non nomads said they would become digital nomads if they had people to join them. Social connection was never a secondary feature of Explorius. It was always the product.
Business Model
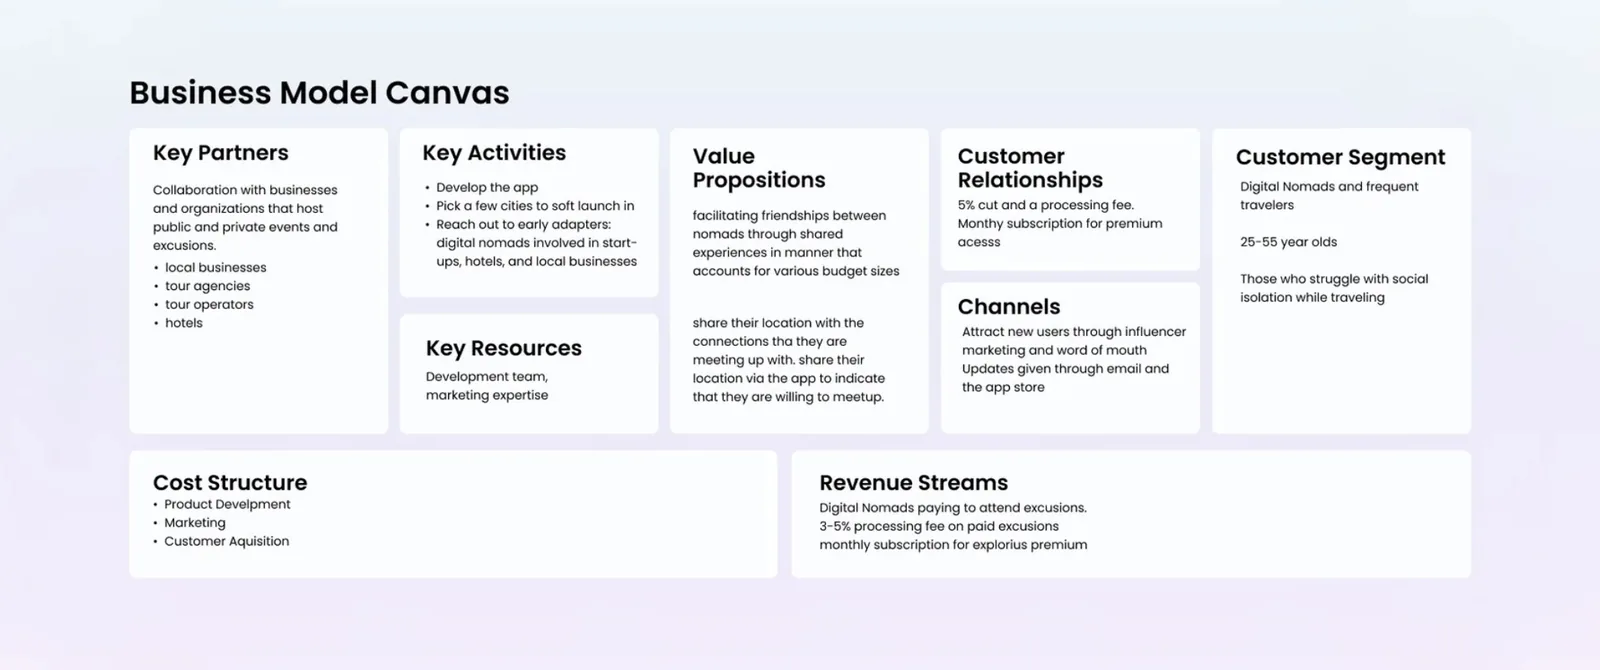
Business Model Canvas: a freemium model anchored by excursion fees and a premium subscription tier
What I Learned
Building Explorius as Prototype Lead taught me that the most impactful design decisions often happen before any screens are drawn. The research phase, specifically recognizing that social isolation and planning overwhelm were the same problem in two different forms, was what made the concept coherent. Every subsequent decision flowed from that insight.
Talking to both active nomads and aspiring nomads revealed that the biggest barrier to adoption was social, not logistical. That finding shaped the entire product.
Two competing concepts, one planning focused and one community focused, were stronger combined. Resisting the urge to pick one and instead finding the synthesis was the pivotal decision of the project.
Lo fi testing exposed navigation and hierarchy issues before any high fidelity work was at risk. Getting feedback on paper before pixels saved significant iteration time.
As Prototype Lead, translating research into a navigable product experience required constant alignment between what users said they wanted and what the architecture could actually support.